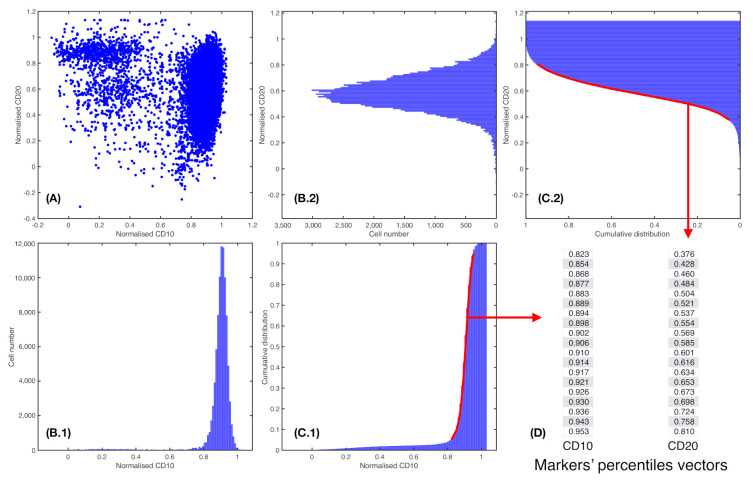
Figure 2.
Percentile vector construction. (A) Scatter plot of a patient i for two normalised parameters, = CD10 and = CD20. (B.1) and (B.2). Histograms cell count of, respectively, = CD10 and = CD20. (C.1) and (C.2). Cumulative distribution of markers = CD10 and = CD20, respectively. In red, percentiles curve from 5th to 95th percentile. (D) Each percentile curve for each patient i and marker j results in a vector , where P represents the number of percentiles chosen.

