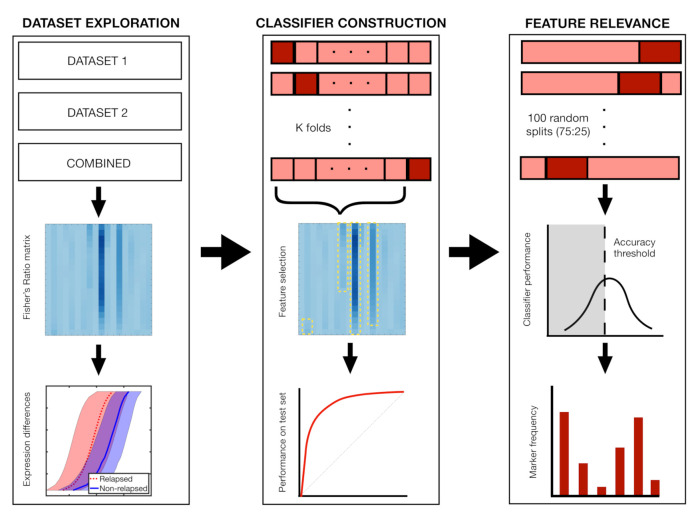
Figure 4.
Main steps of the analysis with Fisher’s ratio. In step 1, we compute differences in marker expression between relapsing and non-relapsing patients, comparing the distributions of the most relevant markers. In step 2, we perform k-fold and Leave-One-Out cross-validation (LOOCV), constructing the classifiers with the most relevant markers of the respective train set. In step 3, we analyse the frequency with which markers are employed in 100 classifiers coming from 72:25 splits of the dataset.

