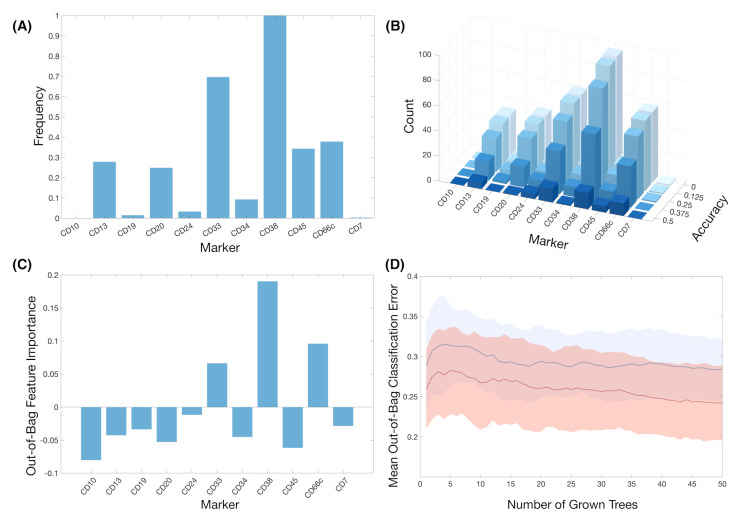
Figure 7.
The results of feature importance analysis. (A) Frequency of the markers in all classifiers after 100 simulations of train-test splitting. (B) Histograms of the number of markers after establishing a threshold for the accuracy. (C) Out-of-bag feature importance of the markers after 100 Random Forests. (D) Mean and standard deviation bands of the Out-of-bag Classification Error in Random Forest analysis for the whole set of markers (blue, solid line) and for the set of markers with positive feature importance CD33, CD38 and CD66c (red, dotted line).

