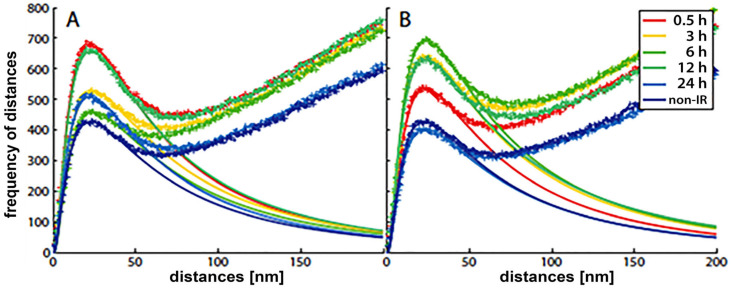
Figure 7.
Frequency histograms of pairwise distances of H3K9me3 heterochromatin label points in breast cancer cell (SkBr3) nuclei at different times post irradiation with two doses of X-rays: (A) 500 mGy, (B) 4 Gy. The distributions of the crosses represent the experimentally measured results. The smooth curves, which follow a logarithmic Gaussian distribution, are fitted curves of the peaks below 100 nm, indicating cluster formation in heterochromatin. According to Ripley’s interpretation, the linearly increasing experimental curves describe a random behavior of molecule positions, i.e., the dense clusters are embedded in an environment of randomly, less densely arranged H3K9me3 marks. Non-IR: the nonirradiated control.

