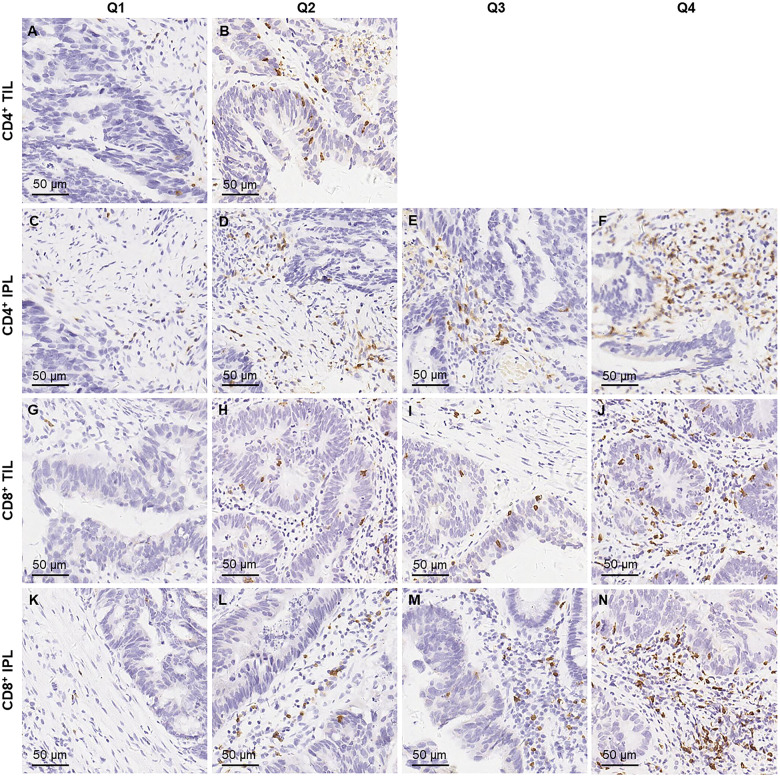
Figure 1.
Classification of densities of TILs and IPLs, stained with immunohistochemistry of CD4 and CD8. (A, B) Two levels of CD4+ TILs, consisting of Q1, 0/mm2; and Q2, >0/mm2. (C–F) Quartiles of CD4+ IPLs, consisting of Q1, ≤25/mm2; Q2, >25 and ≤52/mm2; Q3, >52 and ≤110/mm2; and Q4, >110/mm2. (G–J) Quartiles of CD8+ TILs, consisting of Q1, ≤2/mm2; Q2, >2 and ≤5/mm2; Q3, >5 and ≤10/mm2; and Q4, >10/mm2. (K–N) Quartiles of CD8+ IPLs, consisting of Q1, ≤26/mm2; Q2, >26 and ≤41/mm2; Q3, >41 and ≤50/mm2; and Q4, >50/mm2. TIL, tumor infiltrating lymphocyte; IPL, intratumoral periglandular lymphocyte.

