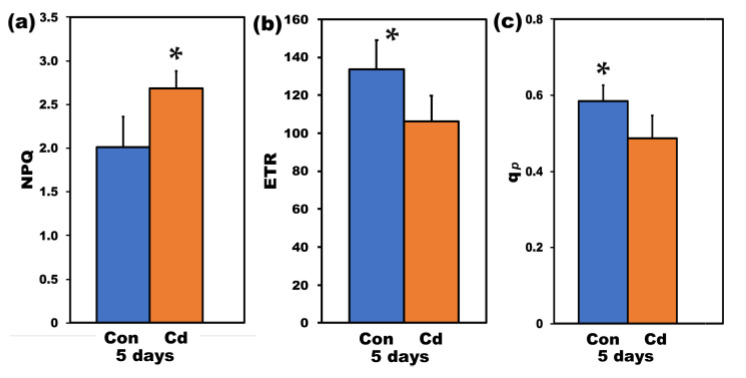
Figure 8.
The non-photochemical fluorescence quenching (NPQ) (a), the relative PSII electron transport rate (ETR) (b), and the relative reduction state of QA, reflecting the fraction of open PSII reaction centers (qp) (c), measured at 900 μmol photons m−2 s–1; of control (con) and 5 days Cd-treated Salvia sclarea plants. Error bars are standard deviations (n = 6). Means between the two treatments that are statistically different (p < 0.05) are marked by an asterisk (*).

