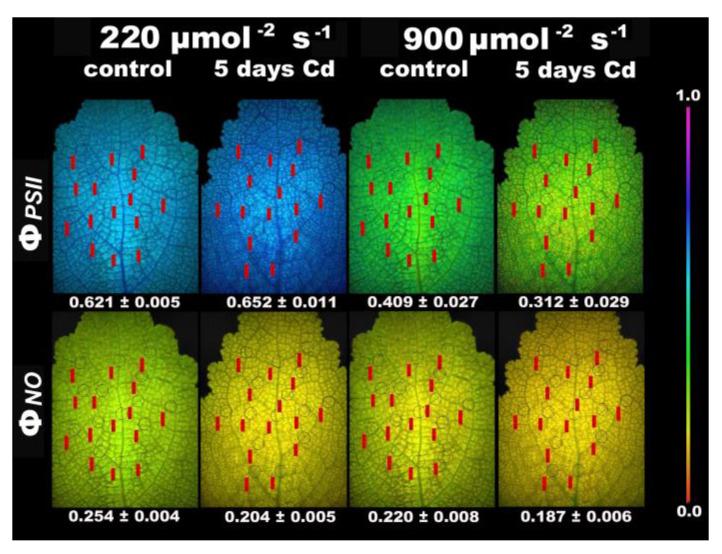
Figure 9.
Chlorophyll fluorescence images of ΦPSΙΙ and ΦNO (measured at 220 μmol photons m−2 s–1 and 900 μmol photons m−2 s–1) of control and 5 days Cd-treated Salvia sclarea plants. The color code depicted at the right-side ranges from values 0.0 to 1.0. The fifteen circles in each image denote the areas of interest (AOI) that are complemented by red labels with the values of the fluorescence parameter, while whole leaf value is presented.

