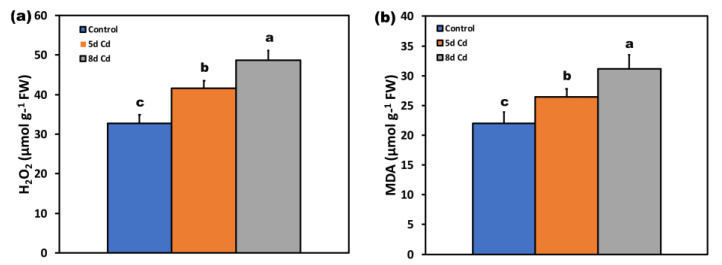
Figure 11.
Changes in hydrogen peroxide (H2O2) generation (a), and lipid peroxidation production (b), in the leaves of Salvia sclarea control (con), and 5- and 8-days Cd-treated plants. Error bars are standard deviations (n = 6). Columns with different letters are statistically different (p < 0.05).

