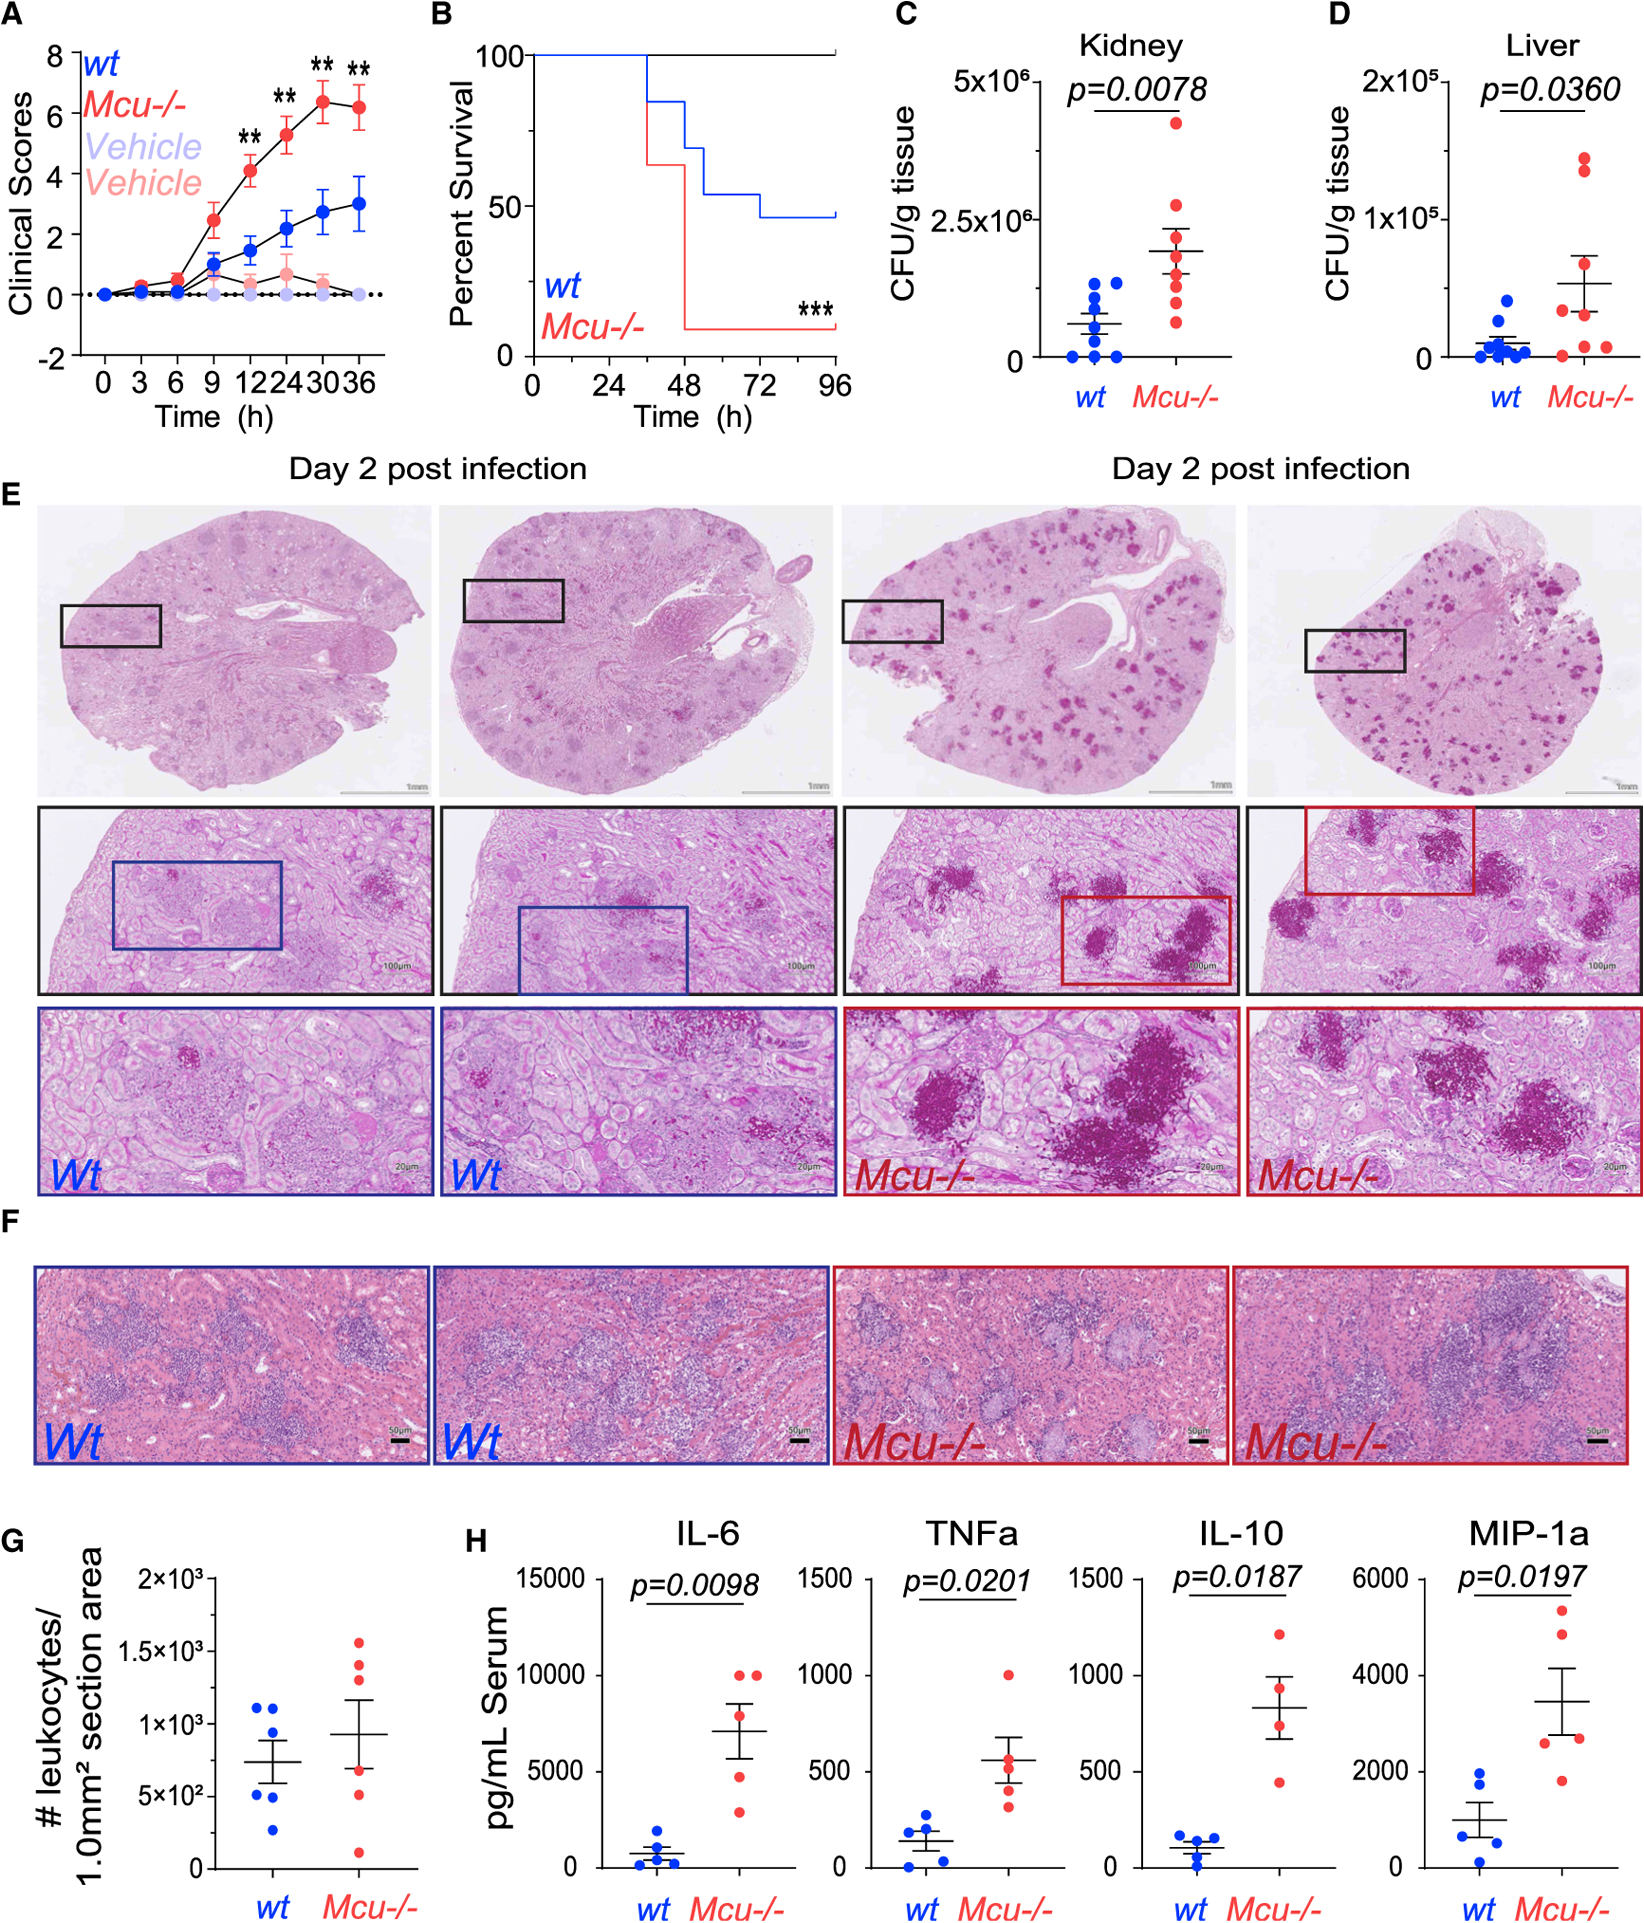
Figure 2. Mcu(M)−/− Mice Are Highly Susceptible to Disseminated Candidiasis.

(A) Clinical scores in WT and Mcu(M)−/− mice injected in the tail vein with 100 μL 1 × 10⁶ C. albicans or vehicle control (100 μL 0.9% saline). Infected Mcu(M)−/− mice (n = 11, mice) trace is shown in red and WT (n = 13, mice) in blue. Vehicle controls for Mcu(M)−/− (n = 3, mice) are shown in light red and WT (n = 6, mice) in light blue. Error bars represent SEM for individual time points across three individual experiments; significance (*p < 0.0500 and **p < 0.005) is reported for each time point according to two-way ANOVA with multiple comparisons.
(B) Kaplan-Meier survival curves for WT and Mcu(M) −/− mice infected with tail vein injections of 100 μL 1 × 10⁶ C. albicans or vehicle control (100 μL 0.9% saline). Infected Mcu(M)−/− (n = 11, mice) trace is shown in red and WT (n = 13, mice) in blue. Vehicle controls for Mcu(M)−/− (n = 3, mice) and WT (n = 6, mice) are shown in black (no mice died). At the 48-h time point, 69.2% of WT mice are alive compared to 9.1% of Mcu(M)−/−. Curve comparison was made using a log-rank (Mantel-Cox) test. Data were collected from three individual experiments; p = 0.0008(***).
(C) Colony-forming units (CFUs) of C. albicans counted per gram of kidney at time of sacrifice in wt (n = 9, mice) and Mcu(M)−/− (n = 8, mice) mice infected with tail vein injection of 100 μL 1 × 10⁶ C. albicans. Vehicle control (100 μL 0.9% saline) for both groups had no CFUs. Error bars represent SEM from three individual experiments; p = 0.0078 according to Mann-Whitney test, two tailed.
(D) CFUs of C. albicans counted per gram of liver at time of sacrifice in WT (n = 9, mice) and Mcu(M)−/− (n = 8, mice) mice infected with tail vein injection of C. albicans (100 μL 1 × 10⁶). Vehicle control (100 μL 0.9% saline) for both groups had no CFUs. Error bars represent SEM from three individual experiments; p = 0.0360 according to Mann-Whitney test, two tailed.
(E) Representative periodic acid-Schiff (PAS) staining on kidney sections from WT and Mcu(M) −/− mice, 2 days after tail vein injection of 100 μL (1 × 10⁶) C. albicans. Sections were mounted on slides and entire slides were imaged at 203. Boxes represent the region of each subsequent magnification. Scale is 1 mm for whole kidney section. Scale is 100 μM and 20 μM for subsequent zooms.
(F) Representative H&E sections from WT and Mcu−/− kidneys. Scale bar, 50 μM.
(G) H&E stained kidneys were blindly scored for recruitment of leukocytes at time of sacrifice in infected mice (tail vein injection of 100 μL 1 × 10⁶ C. albicans). Control mice (100 μL of 0.9% saline) did not show any immune cell recruitment and are not shown. Error bars represent SEM; no significant difference was detected between WT (n = 6, mice) and Mcu(M)−/− (n = 6, mice) according to Mann-Whitney test, two tailed.
(H) Measurement of serum cytokines using Luminex Multiplex assay. Serum samples were collected from WT (n = 5, mice) and Mcu(M)−/− mice (n = 4–5, mice) at the time of sacrifice and the indicated cytokines were measured. Vehicle controls had no detectable levels of serum cytokines. Error bars represent SEM; indicated p values calculated according to Welch’s t test, two tailed.
