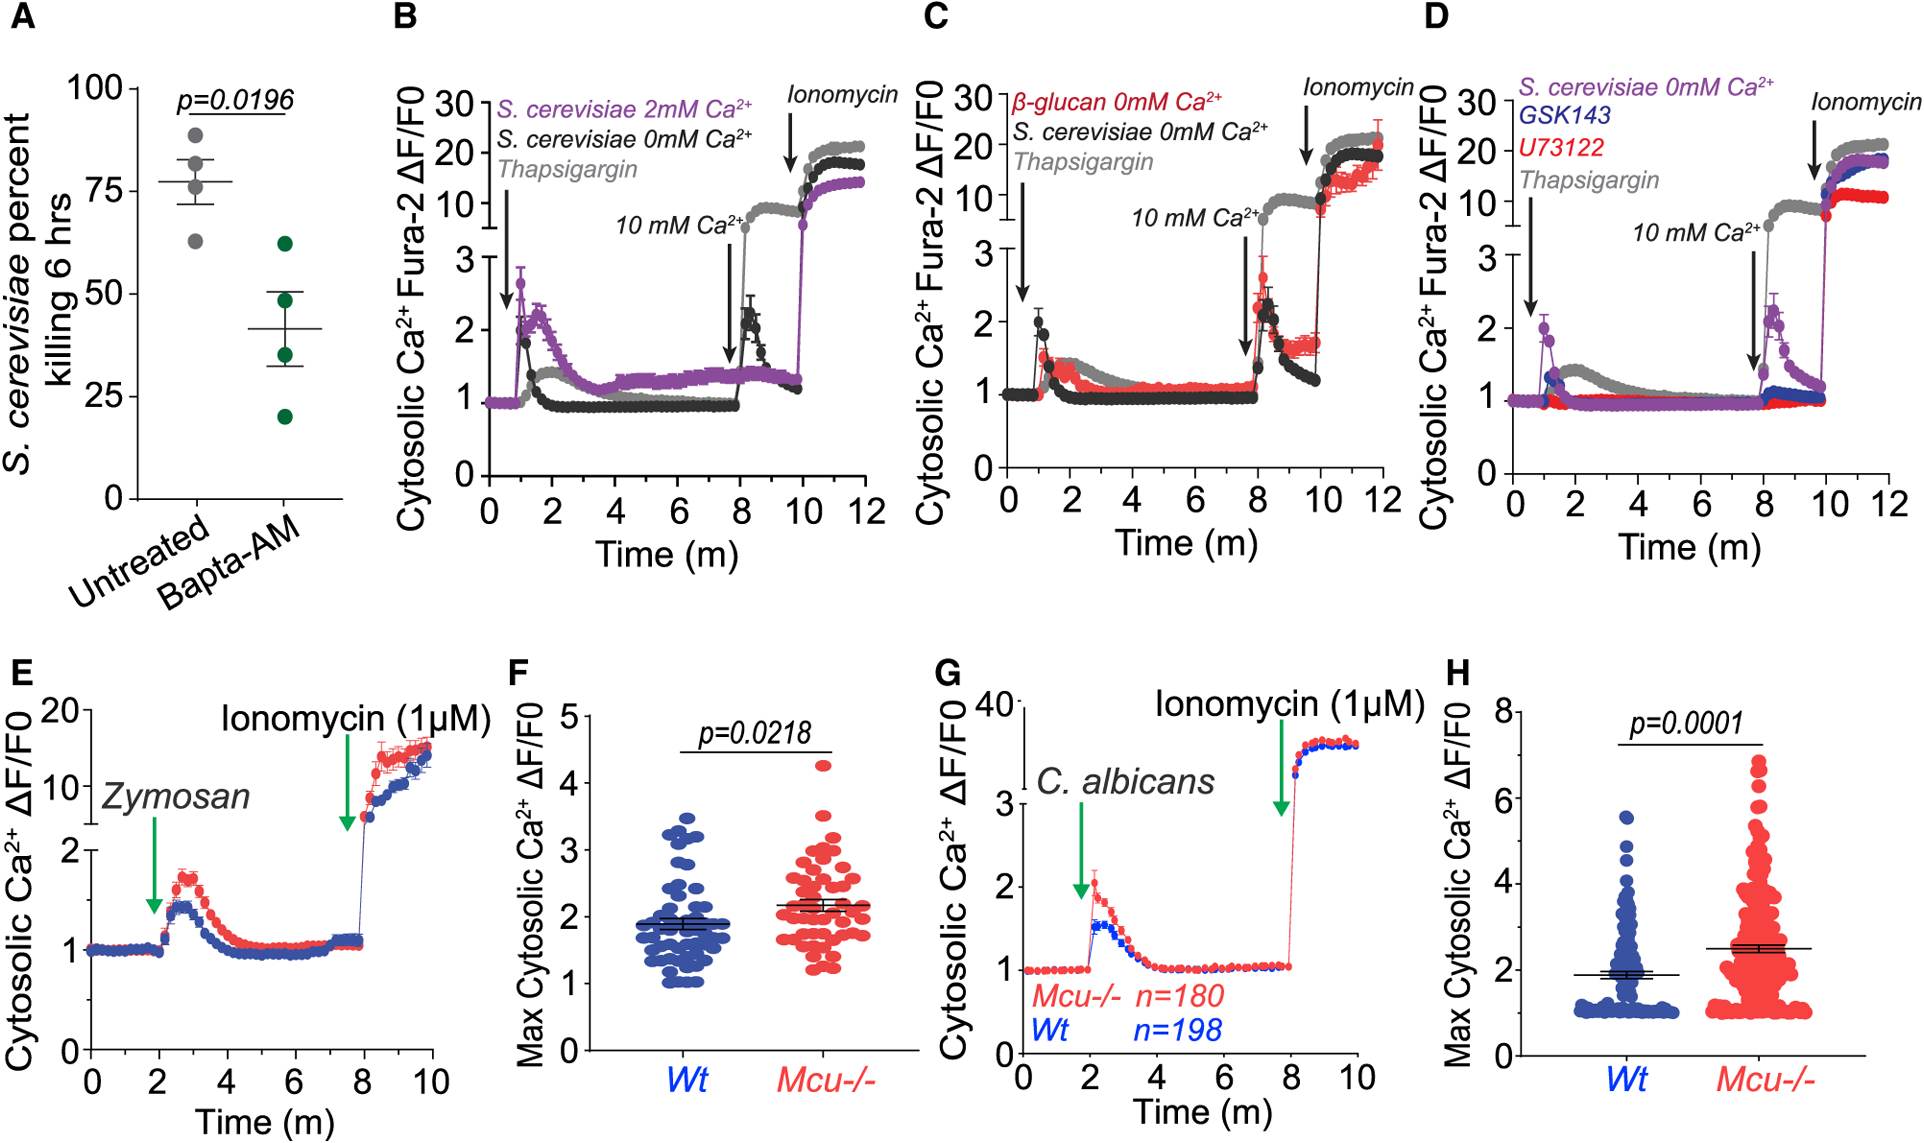
Figure 3. Fungal Pathogens Trigger SOCE, Phase 1 of MCa2+ Signaling.

(A) Killing of S. cerevisiae by BMDMs preloaded with vehicle (n = 4) or 5 μM BAPTA-AM (n = 4). Error bars represent SEM; p = 0.0196 according to Welch’s t test, two tailed.
(B) Cytosolic Ca2+ elevations in BMDMs stimulated with S. cerevisiae extracts in 0 mM (n = 78 cells) or 2 mM Ca2+ (n = 44 cells) or in response to thapsigargin (w/extracellular 0 mM Ca2+) (n = 44 cells) (positive control). [Ca2+] in the bath was raised to 2 mM to record the store-operated Ca2+ entry (SOCE). Ionomycin (1 μM) added last revealed maximum Ca2+ responsiveness of all the Fura-2-AM-loaded cells. The plotted values were calculated as a change in fluorescence/initial fluorescence (ΔF/F0). Error bars represent SEM.
(C) Cytosolic Ca2+ elevations in BMDMs stimulated with S. cerevisiae extracts in 0 mM Ca2+ (n = 78 cells), β-glucan in 0 mM Ca2+ (n = 68 cells), and thapsigargin (positive control). Error bars represent SEM.
(D) Cytosolic Ca2+ elevations in BMDMs stimulated with S. cerevisiae extracts in 0 mM Ca2+ and thapsigargin (positive control). BMDMs were stimulated in the presence of either GSK143 (2 μM, n = 92 cells) or U73122 (1 μM, n = 22 cells). Error bars represent SEM.
(E) Cytosolic Ca2+ elevations in response to zymosan in WT (n = 56 cells) and Mcu−/− (n = 50 cells) loaded with Fura-2 AM. These values are calculated as a change in fluorescence/ initial fluorescence (ΔF/F0). Error bars represent SEM.
(F) Peak cytosolic Ca2+ elevations in response to zymosan in WT (n = 56 cells) and Mcu−/− (n = 50 cells) loaded with Fura-2 AM. Error bars represent SD; p values were calculated according to Welch’s t test, two tailed.
(G) Cytosolic Ca2+ elevations in response to C. albicans extracts in WT (n = 198 cells) and Mcu−/− (n = 180 cells) loaded with Fura-2 AM. These values are calculated as a change in fluorescence/initial fluorescence (ΔF/F0). Error bars represent SEM.
(H) Peak cytosolic Ca2+ elevations in response to C. albicans supernatant in WT (n = 180 cells) and Mcu−/− (n = 198 cells) loaded with Fura-2 AM. Error bars represent SEM; p values were calculated according to Welch’s t test, two tailed.
