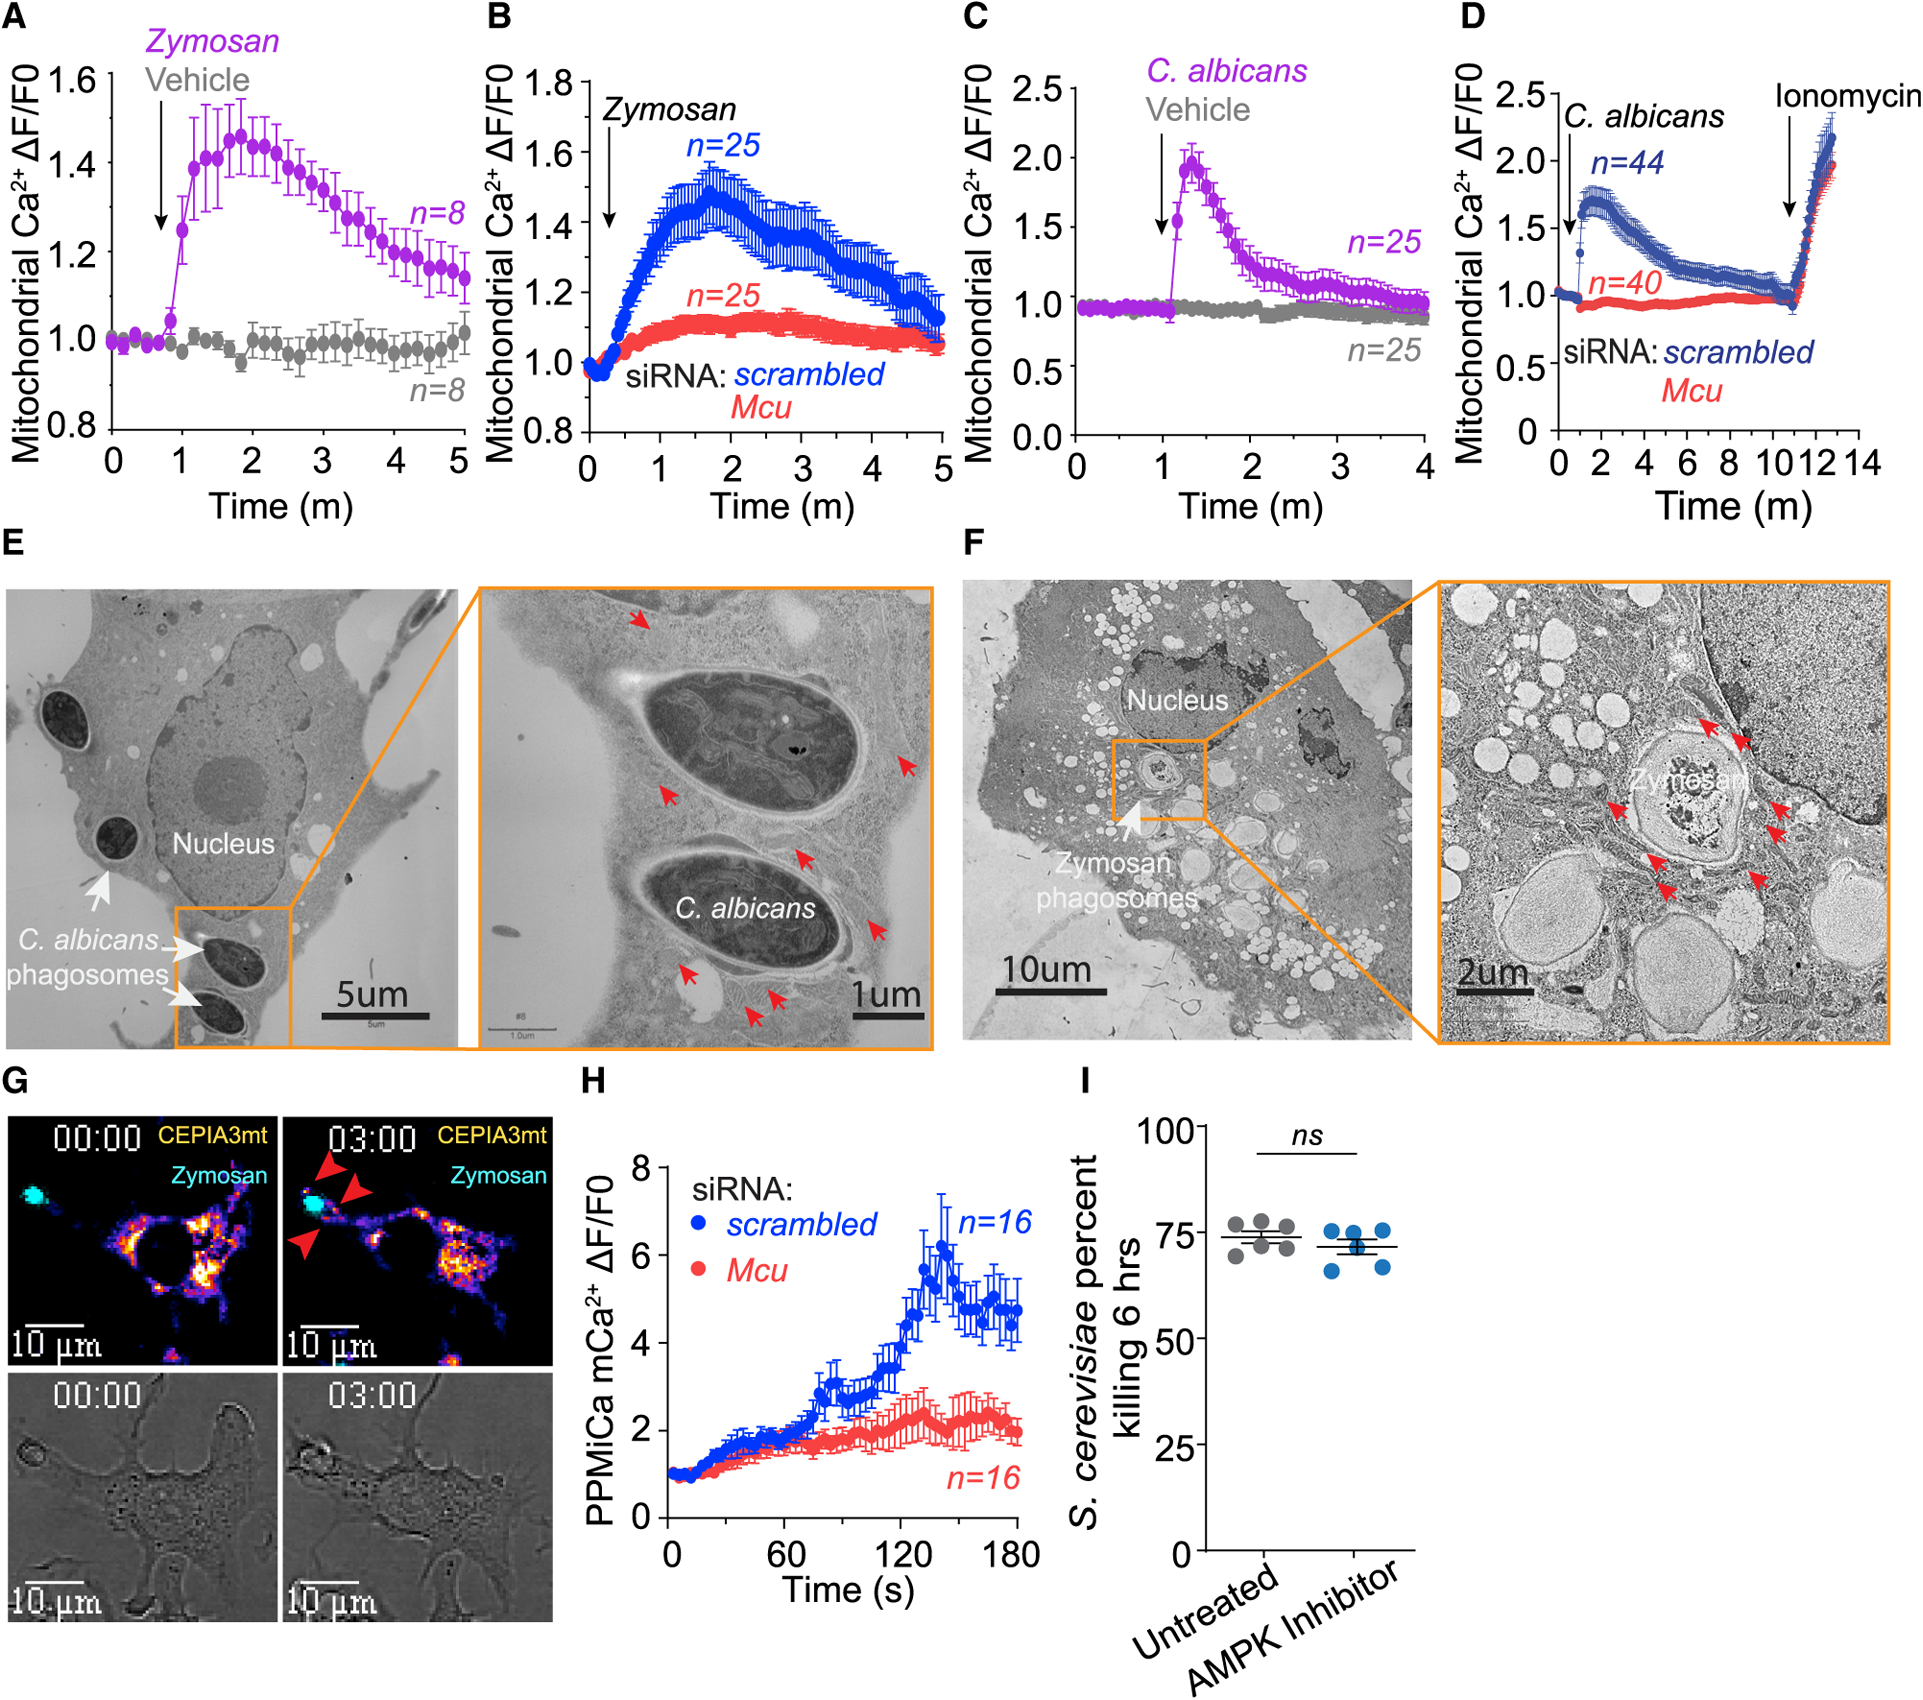
Figure 4. Rapid Elevations in MCa2+ (Phase 2) Are Detected after Fungal Recognition.

(A) Whole-cell mCa2+ elevations in zymosan-stimulated (n = 8 cells) and untreated (n = 8 cells) RAW3mt macrophages. Whole-cell mCa2+ is taken from the average fluorescence intensity of ROIs drawn over the entire mitochondrial network. Cells were sampled every 10 s. Error bars represent SEM.
(B) Whole-cell mCa2+ elevations in zymosan-stimulated RAW3mt macrophages. RAW3mt cells treated with scrambled siRNA (n = 25 cells) or Mcu siRNA (n = 25 cells) were imaged every 3 s. Error bars represent SEM.
(C) Whole-cell mCa2+ elevations in RAW3mt macrophages stimulated with C. albicans extract (n = 25 cells) and vehicle (n = 25 cells). Cells were sampled every 5 s. Error bars represent SEM.
(D) Whole-cell mCa2+ elevations in RAW3mt macrophages stimulated with C. albicans extract. RAW3mt cells treated with scrambled siRNA (n = 40 cells) or Mcu siRNA (n = 44 cells) were imaged every 3 s. 1 μM ionomycin was added at the end of the experiment to reveal maximum mCa2+ uptake. Error bars represent SEM.
(E) Representative TEM image of BMDMs infected with C. albicans for 6 h. Magnification of C. albicans phagosomes shows peri-phagosomal juxtaposition of mitochondria indicated by red arrows.
(F) Representative TEM image of BMDMs exposed to zymosan for 6 h. Magnification of zymosan phagosomes shows peri-phagosomal juxtaposition of mitochondria indicated by red arrows.
(G) Representative PPMiCa responses in RAW3mt cells. Shown are merged images of CEPIA3mt (Fire LUT) and zymosan (cyan LUT) (top) and bright-field images (bottom). Red arrows indicate PPMiCa signals.
(H) PPMiCa traces from zymosan-stimulated RAW3mt macrophages. The values are calculated as a change in fluorescence/ initial fluorescence (ΔF/F0). RAW3mt cells treated with scrambled siRNA (n = 16 cells) or Mcu siRNA (n = 16 cells) were imaged every 3 s. Error bars represent SEM.
(I) Killing of S. cerevisiae by macrophages treated with vehicle (n = 5) or 1 μM AMPK inhibitor dorsomorphin dihydrochloride (n = 5). Error bars represent SEM; p < 0.0001 according to Welch’s t test, two tailed.
