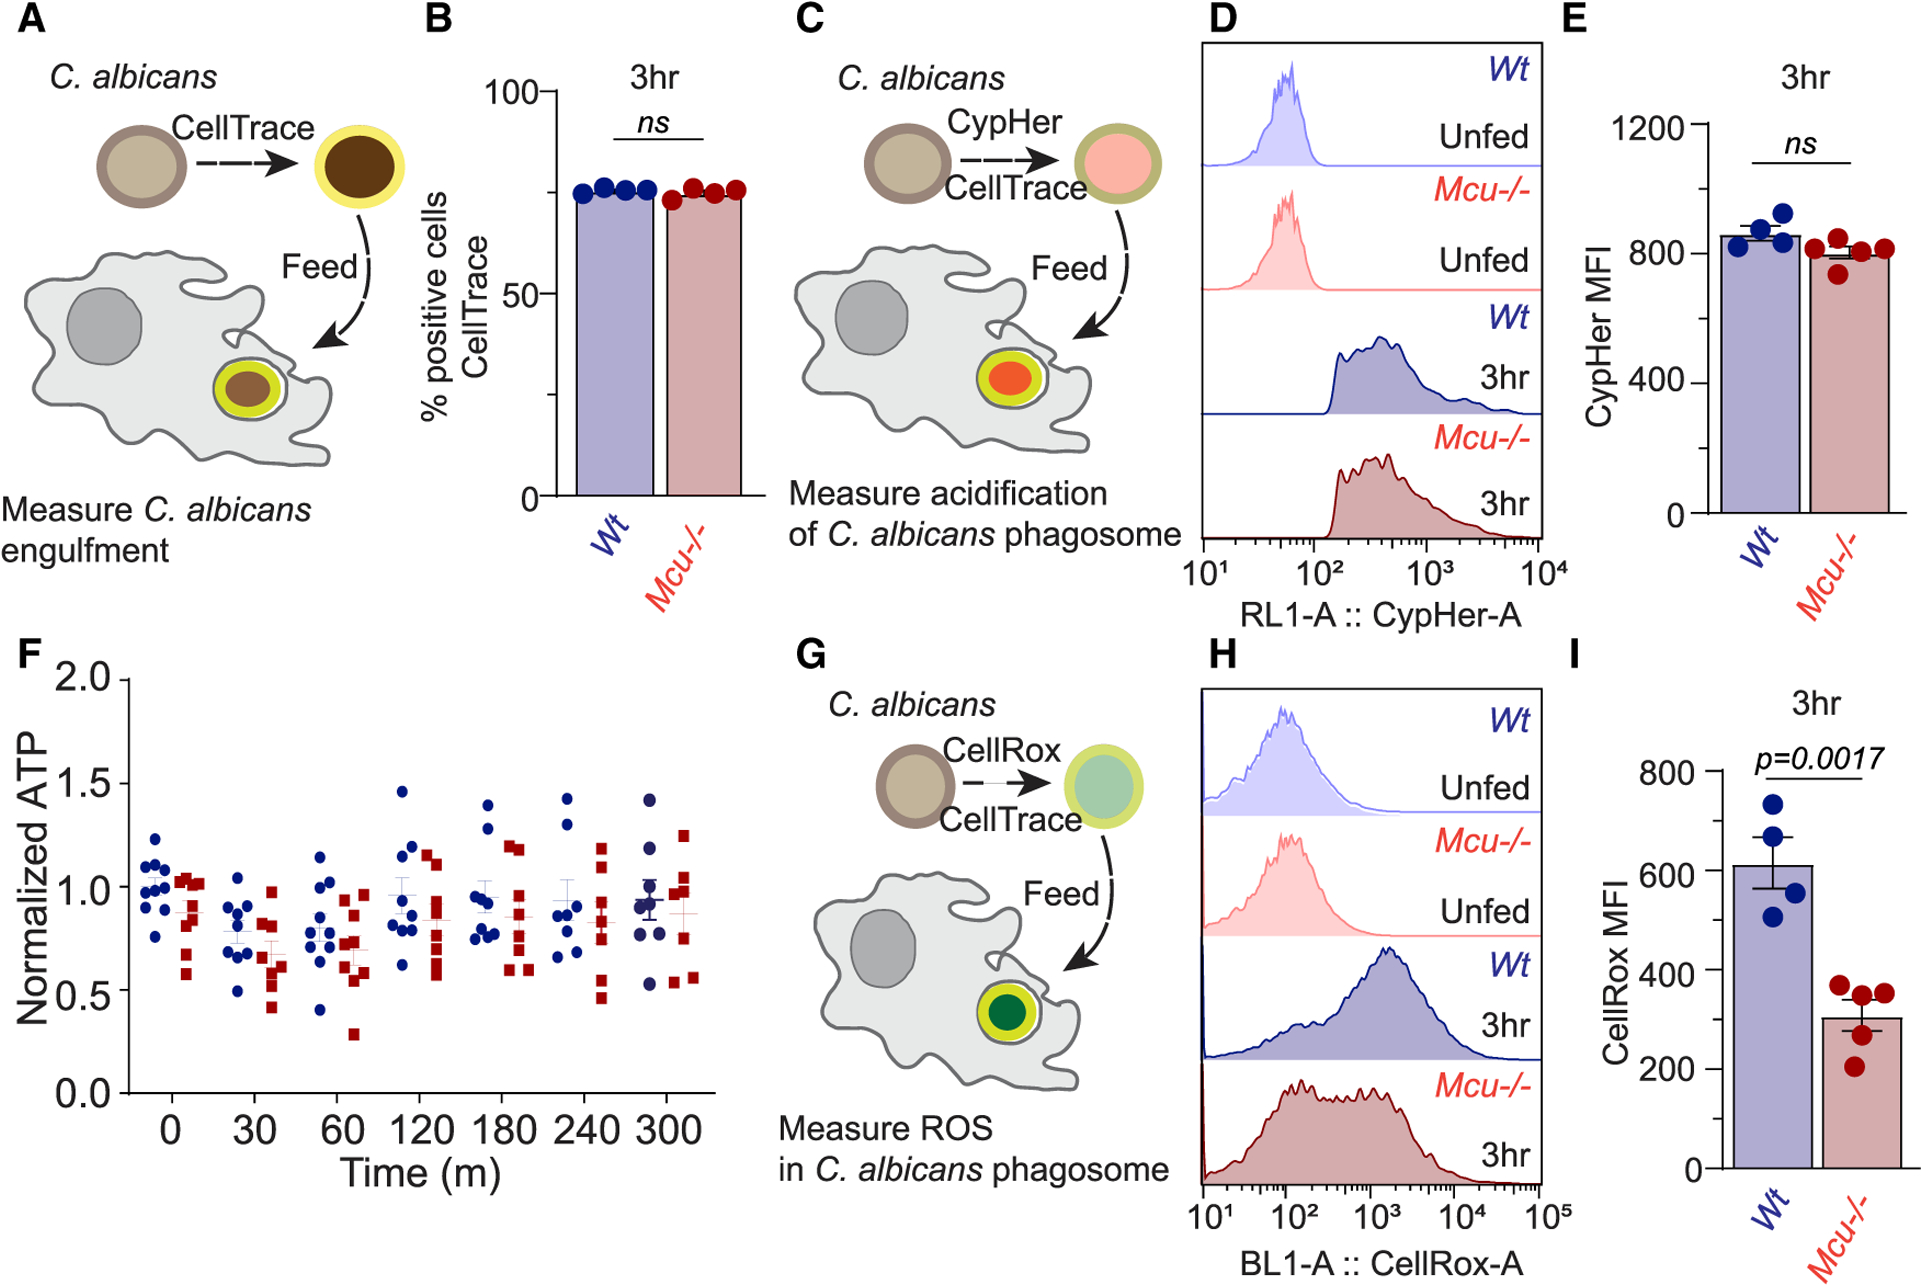
Figure 5. mCa2+ Signaling Controls Phagosomal ROS Production.

(A) Schematized experimental design to measure C. albicans engulfment in macrophages using flow cytometry. C. albicans were labeled with CellTrace Violet (CTV) prior to phagocytosis.
(B) Quantification of CTV-positive cells at 3 h post-phagocytosis for WT (n = 4) and Mcu−/− (n = 4) BMDMs. Error bars represent SEM; no significance was detected according to Welch’s t test, two tailed.
(C) Schematized experimental design to measure phagosome acidification in macrophages using flow cytometry. C. albicans were labeled with CypHer5E (fluoresces with acidic pH) and CTV (to confirm engulfment) prior to phagocytosis.
(D) Flow cytometry histograms of CypHer5E fluorescence intensity in WT and Mcu−/− BMDMs after 3 h of phagocytosis.
(E) Quantification CypHer5E MFI in WT (n = 4) and Mcu−/− (n = 5) BMDMs after 3 h of phagocytosis. Error bars represent SEM; no significance was detected according to Welch’s t test, two tailed.
(F) Quantification of relative ATP levels in WT (n = 8–10 for each time point) and Mcu−/− (n = 8–10 for each time point) BMDMs. Cells were stimulated with zymosan, and ATP levels were measured at each time point. Error bars represent SEM; no significance was detected according to two-way ANOVA, two tailed.
(G) Schematized experimental design to measure phagosomal ROS in BMDMs. C. albicans were labeled with CellRox (reports oxidative stress) and CTV (to confirm engulfment) prior to phagocytosis.
(H) Flow cytometry histograms of CellRox fluorescence intensity in WT and Mcu−/− BMDMs after 3 h of phagocytosis.
(I) Quantification CellRox MFI in WT (n = 4) and Mcu−/− (n = 5) BMDMs after 3 h of phagocytosis. Error bars represent SEM; p = 0.0017 according to Welch’s t test, two tailed.
