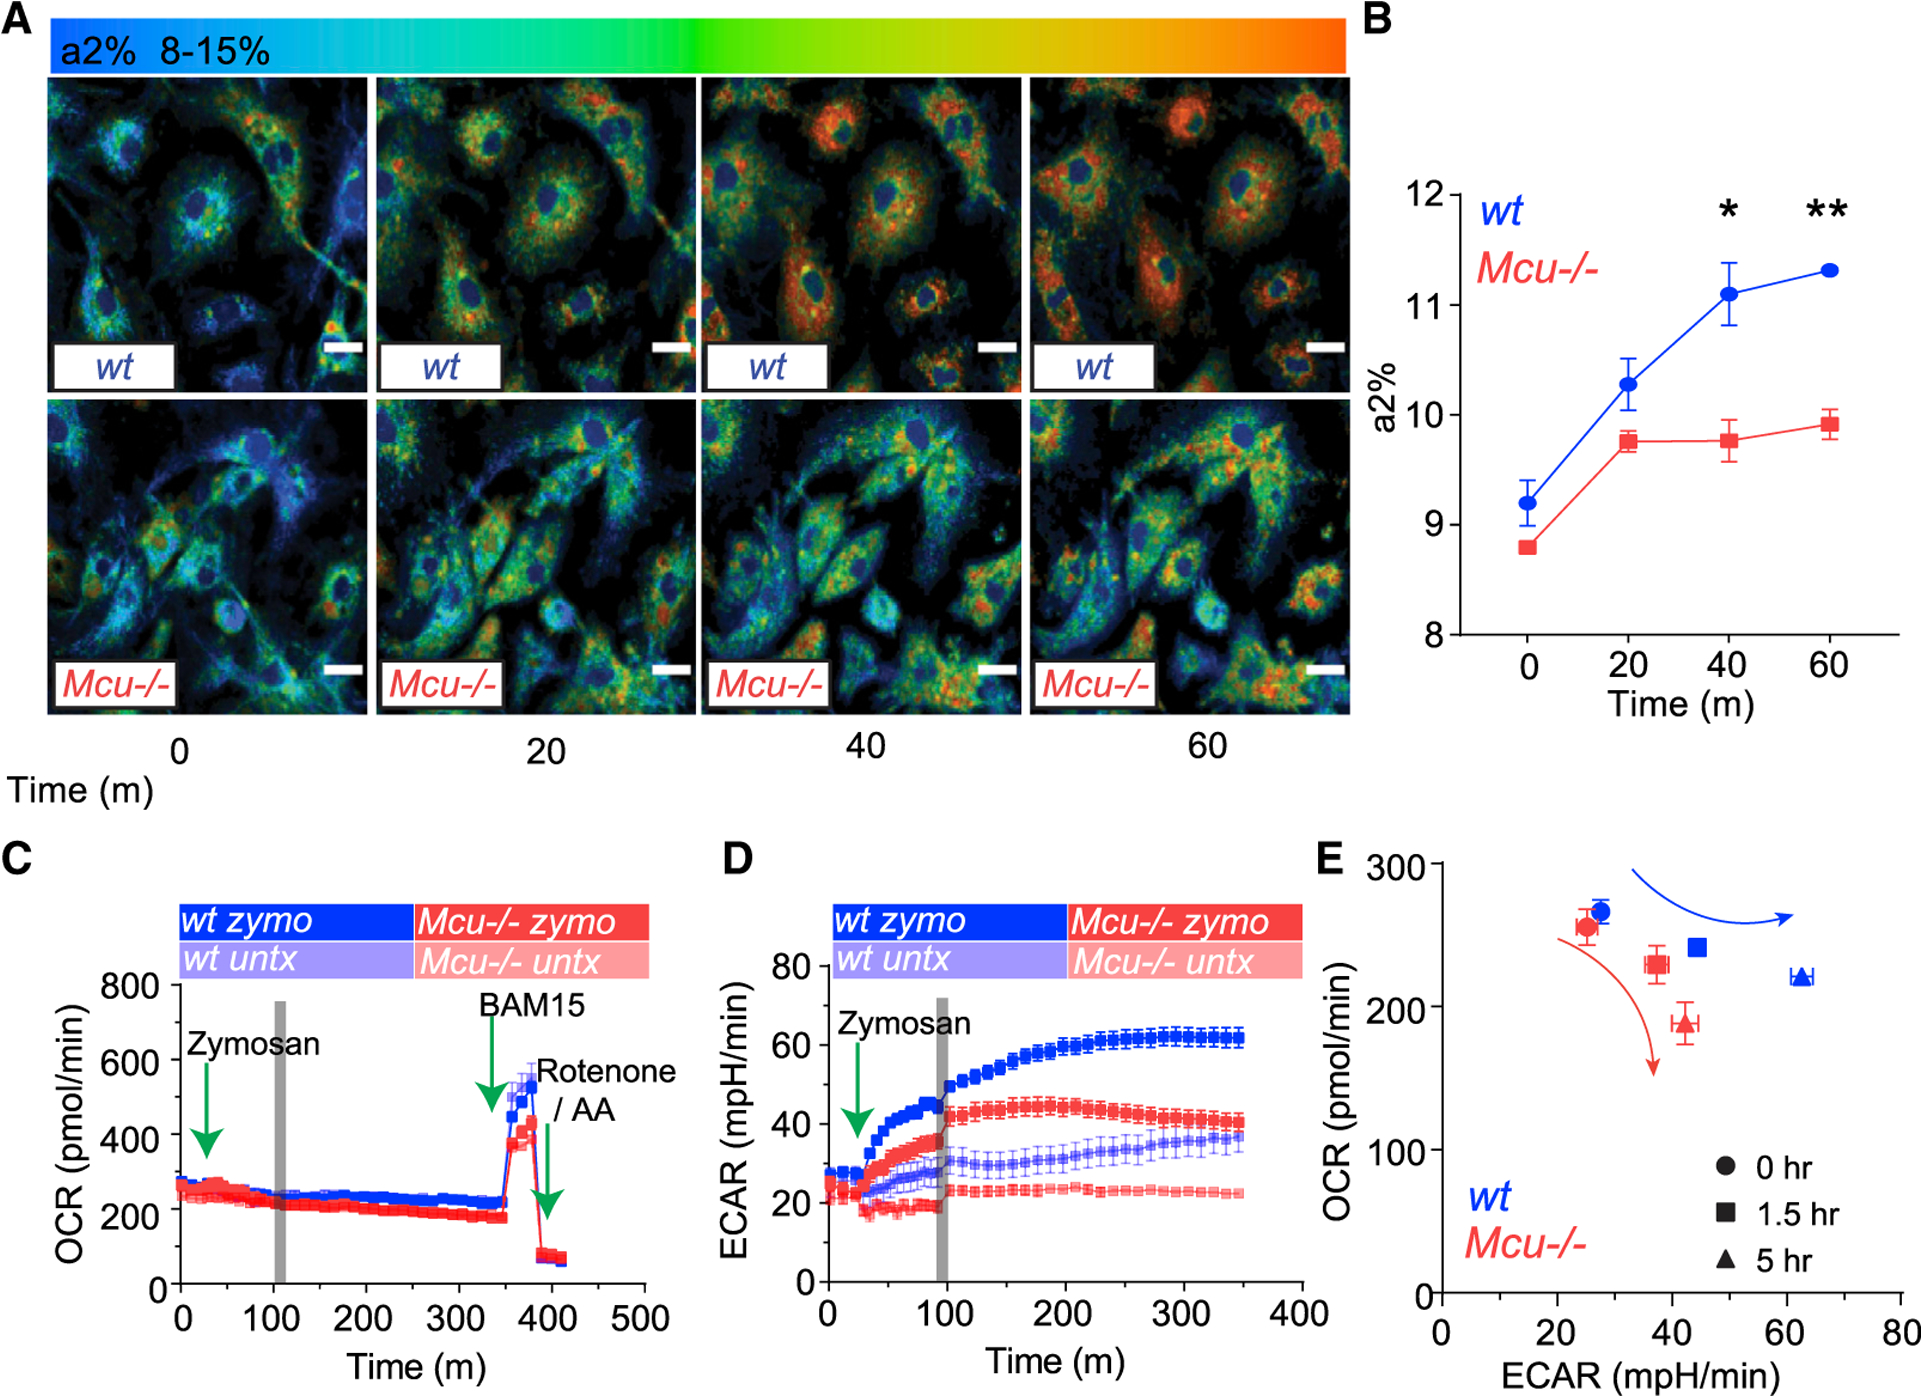
Figure 6. Mcu−/− Macrophages Exhibit an Abnormal Immunometabolic Shift in Response to Fungal Pathogens.

(A) Representative FLIM images from before and after C. albicans engulfment. a2% is shown as a shift from blue to red. Scale bar is 10 μm.
(B) Assessment of a2% (reflects NADPH levels) in WT (n = 4) and Mcu−/− (n = 3) BMDMs. Error bars represent SEM; p = 0.0123 at 40 min and p = 0.0038 at 60 min according to Welch’s, two-tailed test.
(C) Mitochondrial oxygen consumption rate (OCR) in WT (n = 4) and Mcu−/− (n = 4) macrophages in response to zymosan. Cells were measured at baseline for 30 min followed by the injection of zymosan. BAM15 (mitochondrial uncoupler) and rotenone and antimycin A injected at indicated times (green arrows).
(D) Extracellular acidification rate (ECAR) of WT (n = 4) and Mcu−/− (n = 4) macrophages in response to zymosan. Cells were measured at baseline for 30 min followed by the injection of zymosan (green arrow). The gray bar denotes a change in sampling rate from a measurement every 5 min to a measurement every 10 min.
(E) Seahorse bioenergetics profile, shown as relationship of OCR and ECAR, in WT (n = 4) and Mcu−/− (n = 4) BMDMs responding to zymosan.
