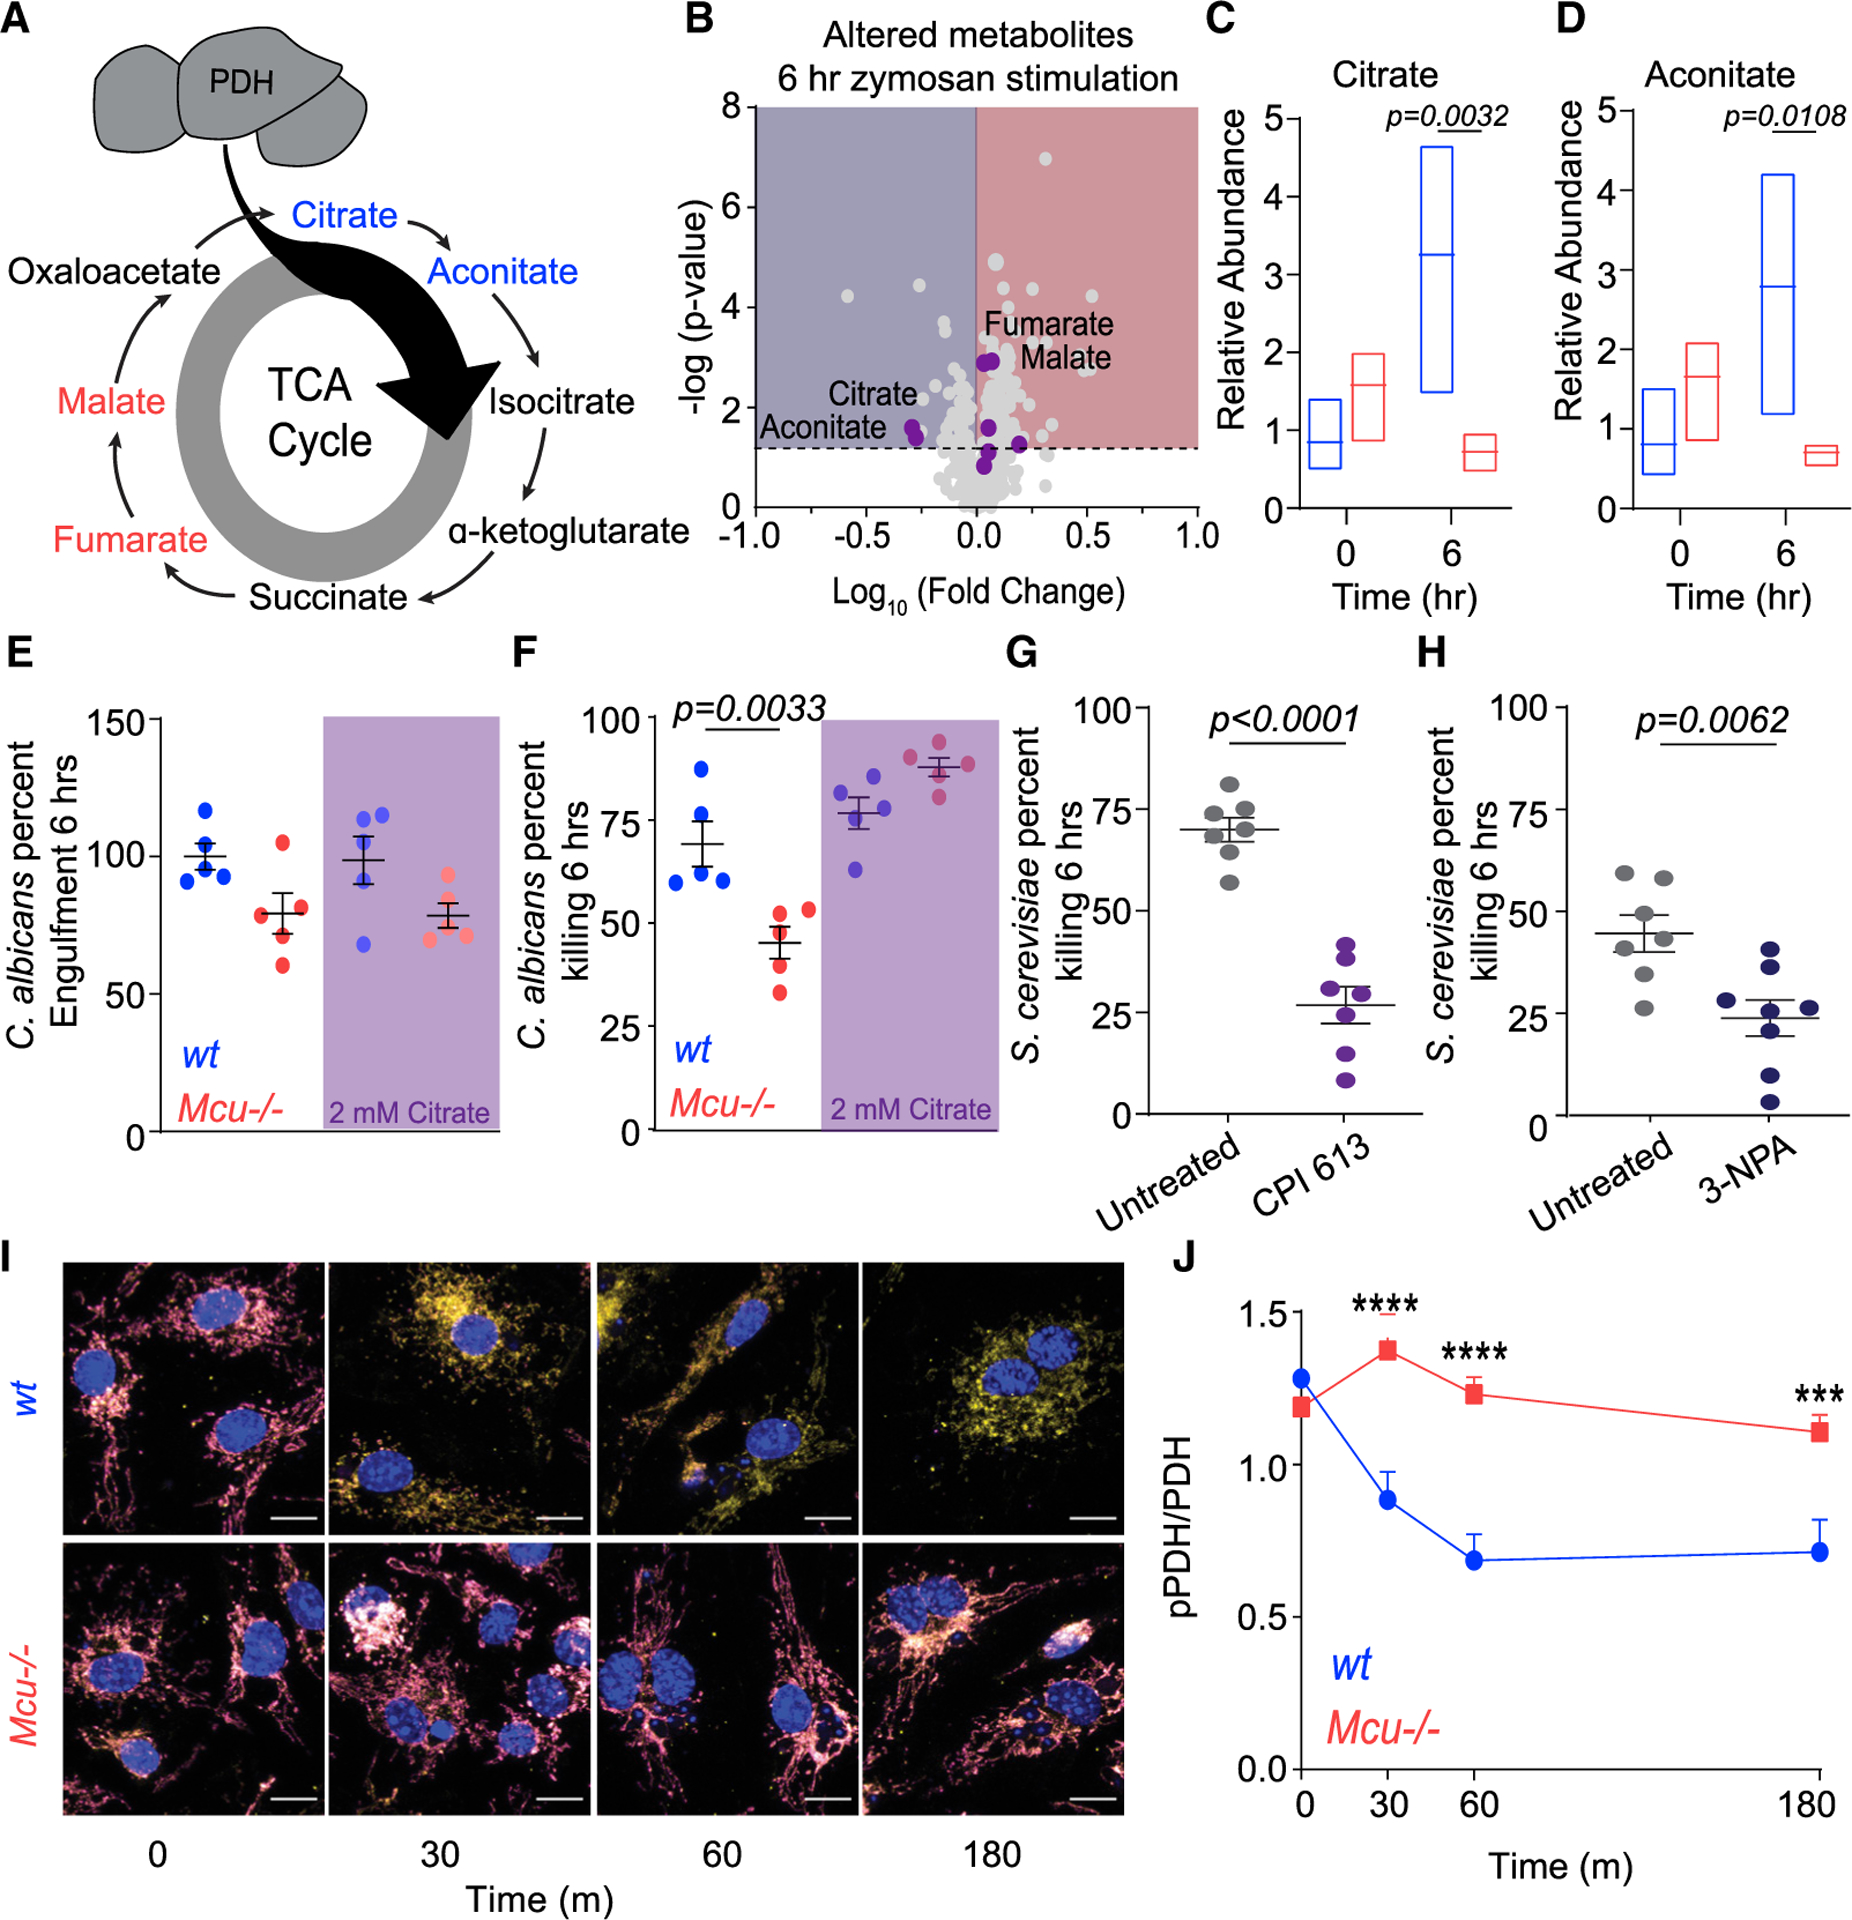
Figure 7. Dysregulated TCA Cycle Underlies Defective Killing by Mcu−/− Macrophages.

(A) Schematic of TCA cycle. Metabolites reduced in Mcu−/− BMDMs responding to zymosan (6 h) are blue. Metabolites that increased in Mcu−/− BMDMs are red.
(B) Volcano plot of significantly altered metabolites in Mcu−/− macrophages compared to WT following 6 h of zymosan stimulation. The dotted horizontal line represents the 75th percentile for −log (p values). TCA cycle metabolites are shown as purple dots.
(C) Relative abundance of citrate measured in WT (blue) and Mcu−/− (red) BMDMs at baseline and 6 h following zymosan stimulation. Floating bars represent the minimum to maximum, and the line is at the mean for each dataset; p = 0.0032 was detected according to two-way ANOVA, two tailed.
(D) Relative abundance of aconitate measured in WT (blue) and Mcu−/− (red) BMDMs at baseline and 6 h following zymosan stimulation. Floating bars represent the min to max and the line is at the mean for each dataset; p = 0.0108 was detected according to two-way ANOVA, two tailed.
(E) C. albicans engulfment in WT (n = 5) and Mcu−/− (n = 5) BMDMs in the absence and presence of 2 mM citrate. Error bars represent SEM; p = 0.0033 according to one-way ANOVA.
(F) C. albicans killing by WT (n = 5) and Mcu−/− (n = 5) BMDMs in the absence and presence of 2 mM citrate. Error bars represent SEM; p = 0.0033 according to one-way ANOVA.
(G) Killing of S. cerevisiae by BMDMs treated with vehicle (n = 7) or 100 μM CPI 613 (n = 7). Error bars represent SEM; p < 0.0001 according to Welch’s t test, two tailed.
(H) Killing of S. cerevisiae by BMDMs treated with vehicle (n = 7) or 100 μM 3-nitropropionic acid (n = 8). Error bars represent SEM; p < 0.0001 according to Welch’s t test, two tailed.
(I) Representative IF images from WT and Mcu−/− BMDMs in response to C. albicans. pPDH (magenta LUT), PDH (yellow LUT), and nucleus (DAPI; blue LUT) were acquired using LSM880 confocal microscope. Scale bar, 10 μm.
(J) Quantification of pPDH/PDH from WT and Mcu−/− macrophages in response to C. albicans. Cells quantified for each time point are 0 min (n = 31), 30 min (n = 23), 60 min (n = 31), and 180 min (n = 22) for wt. For Mcu−/−, n = 40 cells were quantified (all time points). Error bars represent SEM. ***p < 0.001 and ****p < 0.0001; p values were calculated according to two-way ANOVA, two tailed.
