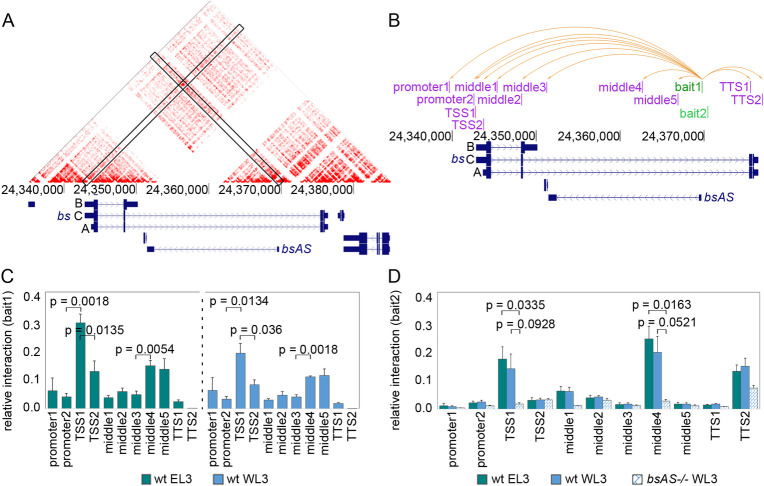
Fig 4. bsAS and bs are co-regulated through the interaction of their TSSs.
(A) JuiceBox tool [76] was used to visualize high-resolution HiC maps generated in Kc167 cells [61]. A strong interaction signal is observed in the intersection between bs TSS1 and bsAS TSS. (B) Representation of bs locus and the tested interactions inside this region. Two different baits were anchored at bsAS TSS (in green) and interaction enrichment was assessed for each bait by 3C experiments against all depicted regions (in pink). Orange arrows represent all tested interactions for bait1. The same interactions were tested for bait2. (C) Interaction between bait1 and bs locus in wild type eyes (left panel) and wings (right panel). Interaction enrichment is significantly higher between bsAS TSS and TSS1 than between the bsAS TSS and the other tested regions, both in wings and eyes. A significant increase in relative interaction is also detected between bsAS TSS and middle regions 4 and 5. (D) Interaction between bait2 and bs locus in wild type wings and eyes and bsAS-/- wings. The interaction between bait2 and TSS1 is still enriched in wild type tissues, but it is heavily impaired in bsAS mutant wings. Also the interaction between bsAS TSS and middle4 region is lost in the mutant background. In (C) and (D), error bars represent the SEM of at least three biological replicates. Statistical significance was computed by two-tailed t-test.

