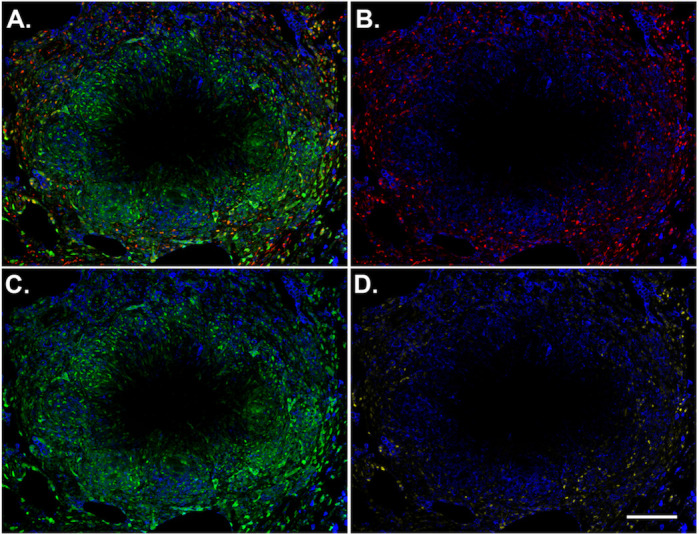
Fig 4. Granulomas have spatially-distinct patterns of STAT1 and STAT3 phosphorylation, including phospho-STAT1+STAT3+ cells.

A macaque granuloma was stained for p-STAT1 (green) and p-STAT3 (red) and CD163 (blue). ImageJ was used to separate the (A) merged channels into (B) p-STAT3 and (C) and p-STAT1 channels. (D) ImageJ’s image calculator function was used with the AND command to identify pixels where p-STAT1 and p-STAT3 are colocalized (yellow). CD163 (blue) was included in each panel for context. Scale bar represents 200 μm.
