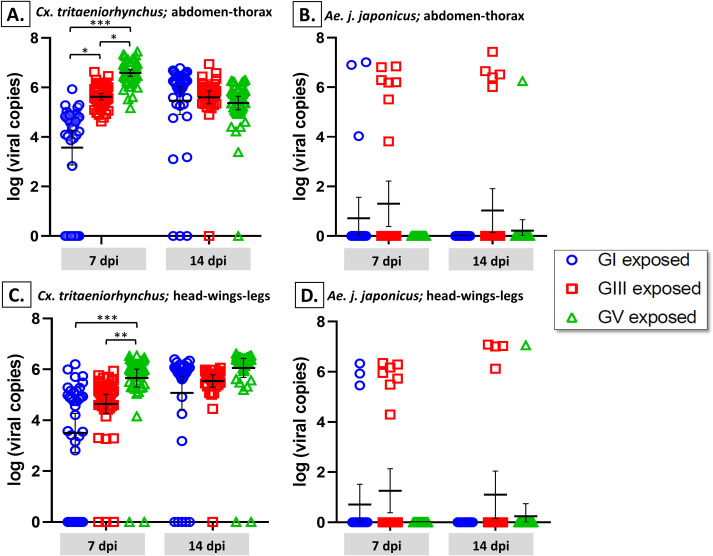
Fig 3.
Differences in viral load of Cx. tritaeniorhynchus (A and C) and Ae. j. japonicus (B and D) infected with three different genotypes of JEV (GI, GIII and GV). Mosquitoes were fed a virus–blood mixture containing either GI, GIII or GV. At 7 and 14 days post infection (dpi), the abdomen–thorax (A and B) and head–wings–legs (C and D) were harvested from individual mosquitoes and the viral load titrated using RT-qPCR. The bars represent the mean with 95% confidence interval (CI). Multiple comparisons of proportions using Kruskal Wallis corrected with Bonferroni’s method was applied to determine significant differences between JEV genotypes at each time point. Only statistically significant differences are shown by the asterisks; ***, p < 0.0001; **, p < 0.001; *, p < 0.01.

