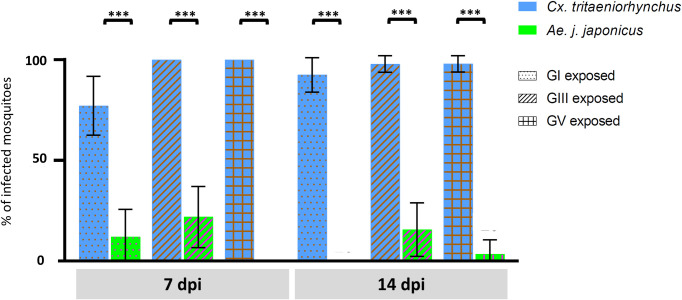
Fig 4. Comparisons of proportion of infected adults (%) between Cx. tritaeniorhynchus and Ae. j. japonicus tested to three different genotypes of JEV (GI, GIII, and GV).
Cx. tritaeniorhynchus (blue bars) or Ae. j. japonicus (green bars) mosquitoes were tested to JEV GI, GIII or GV strains. At 7 and 14 days post infection (dpi), the abdomen–thorax were harvested from individuals and the viral load titrated using RT-qPCR. The bars represent the proportion of individuals infected as a percentage and error bars represent the 95% confidence interval. Fisher’s exact test (two-tailed) corrected with Bonferroni’s method was applied to determine significant differences between the two mosquito species at the same time point and genotype. *, p < 0.0001.

