
Fig 6. Role of Cx43 in Ply-mediated Ca2+ increase.
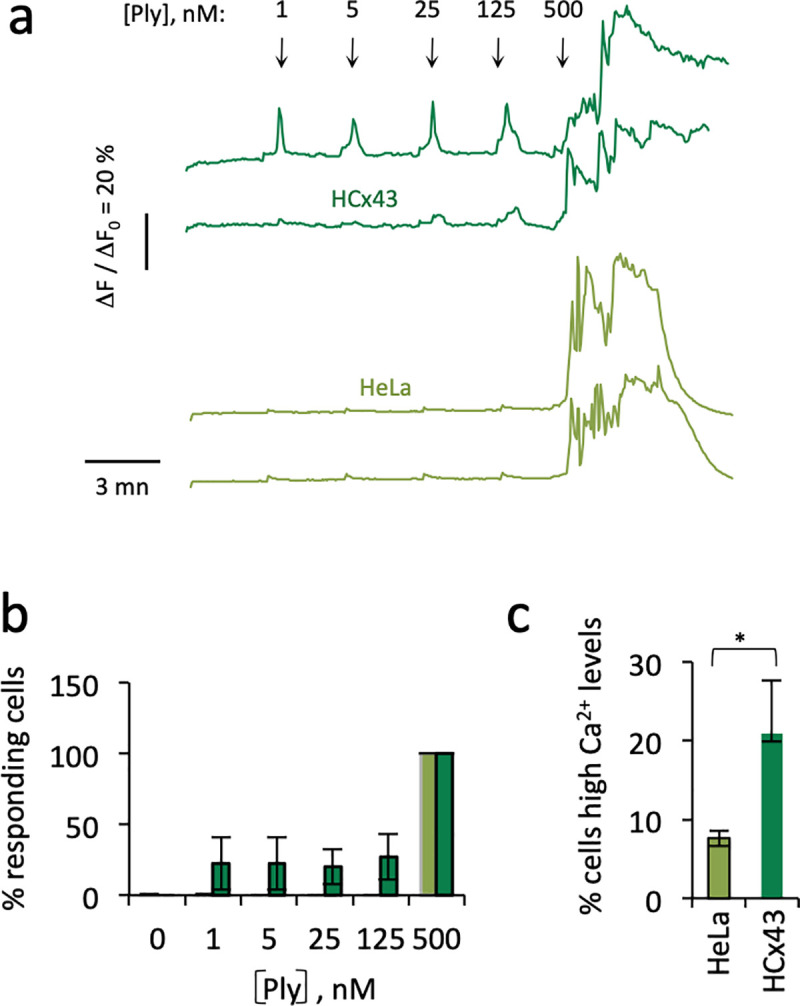
Cells were loaded with the Ca2+ indicator Fluo-4 and Ca2+ imaging was performed following addition of purified Ply at the indicated concentrations. a, representative traces of Ca2+ variations in single cells. The arrows indicate the addition of Ply at the indicated concentrations. b, c, light green bars: HeLa cells; dark green bars: HCx43 cells. b, percent of cells showing Ca2+ responses. HeLa cells; N = 3, 145 cells. HCx43 cells. N = 3, 107 cells. c, percent of cells with lasting high Ca2+ levels following treatment with 500 nM Ply. HeLa cells, N = 3, 130 cells. HCx43 cells, N = 3, 89 cells. Kruskal-Wallis. *: p = 0.049.