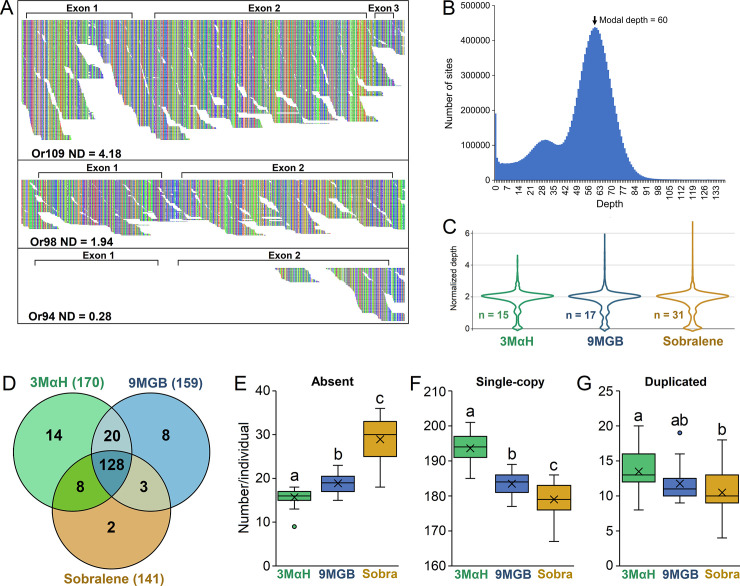
Fig 3. Visualization of reads aligned to chemoreceptor loci revealed variation in coverage that indicated potential copy number variation.
(A) For example, JAC01 Or109 had much deeper coverage than Or98, while Or94 had reads mapped only at the end of the second exon. The Tablet software program was used for visualization of the mapped reads. (B) To quantify these differences for comprehensive analysis of all 245 chemoreceptor loci, we calculated background-normalized sequencing depth of each gene using the modal depth across the exons in all protein coding genes. (C) A central tendency of ~2 is expected for single copy genes with two intact alleles. Normalized depth was rounded to the nearest whole number as a proxy for copy number (CN). (D) The number of intact chemoreceptors (CN≥2) in all individuals of a chemotype ranged from 141 (Sobralene) to 170 (3MαH). (E) The mean number of absent (CN = 0) genes differed among all chemotypes (P <0.001), with Sobralene individuals having the most and 3MαH individuals having the fewest. (F) Accordingly, the number of single-copy (CN = 2) genes differed among all three chemotypes (P <0.001), with 3MαH individuals having the largest number and Sobralene individuals having the fewest. (G) The number of duplicated genes (CN>2) differed only between 3MαH and sobralene individuals.

