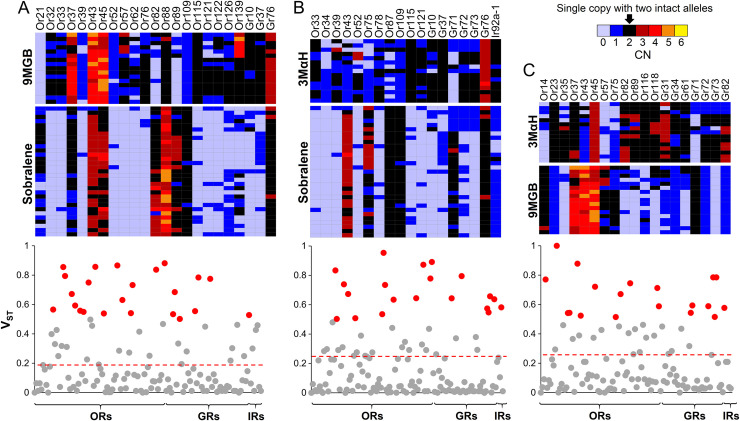
Fig 5. VST was used to identify the most differentiated genes based on CNV.
Heatmaps of copy number (CN) and Manhattan plots of VST between (A) sobralene and 9MGB, (B) sobralene and 3MαH, and (C) 9MGB and 3MαH (VST >0.5 highlighted in red). The dashed lines indicate the threshold for significance (0.99) based on 1,000 permutations. Heatmaps illustrate CN of genes with VST>0.5. Of the 60 genes with VST>0.5 in all three pairwise analyses, 43 were ORs, 16 were GRs and only one was an IR.

