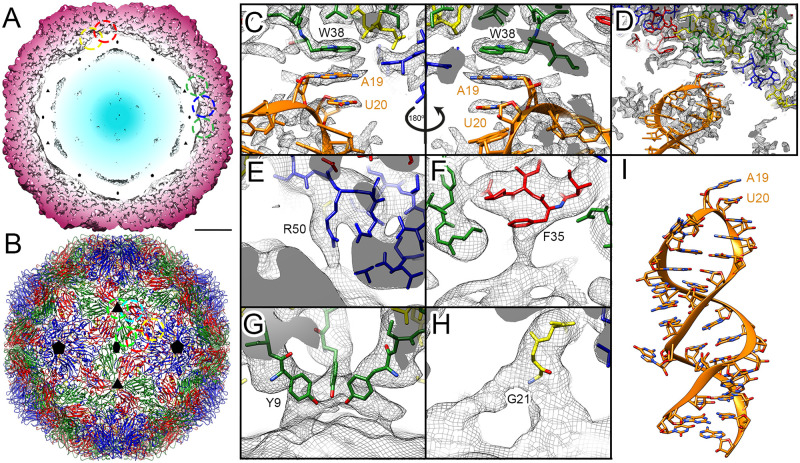
Fig 3. Contacts between CP and gRNA in EV-E.
(A) Radially colour-coded slab of the cryo-EM unsharpened density map of EV-E capsid shown at 1.6 σ and viewed along a two-fold axis. Dashed circles indicate contacts between CP (dark red) and gRNA (white and blue). Symbols indicate icosahedral symmetry axes. Bar = 50 Å. (B) Atomic model of the front half capsid of EV-E shown as ribbon diagrams, colour-coded as in Fig 2 and viewed along a two-fold axis. Colour-coded dotted circles indicate location of contacts between CP and gRNA on the capsid. (C-H) Detail of the contacts between CP and gRNA indicated in (A, B). The cryo-EM density maps are shown as grey mesh with the density corresponding to RNA facing the bottom part. The atomic model is shown as ribbon diagrams and sticks coloured in orange for the RNA, and sticks colour-coded as previously for the CP. Residues involved in the contact are indicated and coloured by heteroatom. (C) Base stacking contact close to two-fold axis (green dotted circle in A, B) between VP2 W38 and A19-U20 bases of the RNA model generated for the most frequent PS in EV-E (Fig 1B), fitted into a local resolution low-pass filtered density map obtained after symmetry expansion and focused classification on two-fold axes shown at 1.8 σ. (D) Zoom out view of (C) showing fitting of the RNA model into lower resolution density adjacent to the contact. (E) Contact between VP1 R50 and RNA close to two-fold axis (blue dashed circle in A, B) fitted into the same map as in (C) but low-pass filtered to 5 Å resolution shown at 1.3 σ. (F) Contact between VP3 F35 and RNA close to two-fold axis (red dashed circle in A, B) fitted into the icosahedrally averaged map low-pass filtered to 5 Å resolution shown at 1.5 σ. (G) Contact located on the three-fold axis (green dashed circle in A, B) involving VP2 Y9 from three different asymmetric units fitted into the icosahedrally-averaged unsharpened map shown at 1.5 σ. (H) Contact between VP4 G21 and RNA close to five-fold axis (yellow dashed circle in A, B) fitted into the same map as in (G). (I) 3D model of the lowest energy fold for Peak #9 of the Bernoulli Plot obtained by structure prediction in RNA composer shown as in (C, D).

