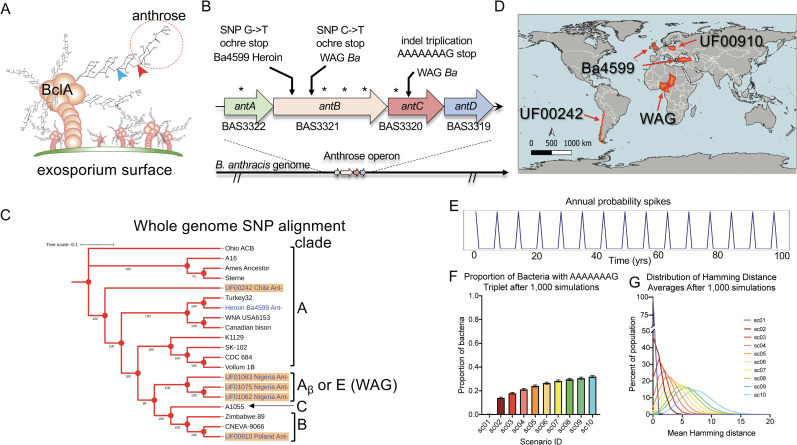
Fig 1. Evidence of convergent evolution toward anthrose-deficient spores.
(A) Structure of the anthrose (red circle) monosaccharide shown in relation to the tetrasaccharide glycosylations of BclA and the exosporium surface. The GalNAc residue is not shown, and a number of glycosylations per BclA protein are underrepresented for clarity. Red chevron indicates bonds absent in antC or antD mutants. Blue chevron indicates bonds not formed in antB mutants. Bonds are indicated on 1 tetrasaccharide unit for clarity. (B) The Ba Sterne anthrose operon with nonsense mutations indicated by arrows and silent mutations indicated by asterisks found in anthrose-deficient WAG strains and in silico analysis of Ba4599. (C) Whole genome SNP phylogenetic trees representing the phylogenetic relationship of the anthrose-deficient strains to selected type strains in Anthracis lineages. Ant− strains appear in blue type, and strain names with an orange background indicate that they are in the Martin Hugh-Jones Global Anthrax collection. (D) A global map created with QGIS3.8 indicating the countries (in orange) where Ant− Ba have originated or caused infections. (E) Mutation probability spikes as a function of time in our in silico simulation of Ant− mutation. (F) Proportion of bacteria presenting with the AAAAAAAG doublet to triplet stop mutation found in WAG strains (gold) after one thousand 600-year simulations at increasing mutation probability scenarios from natural (sc01) to a 1,000 times mutation probability multiplier (sc10). (G) The average number of base pairs different after the triplication event combined with point mutations in the simulated population after the 600-year simulation compared to the wild-type input DNA fragment. The data underlying Fig 1C, 1F and 1G can be found in S1 Data. WAG, West African Group.

