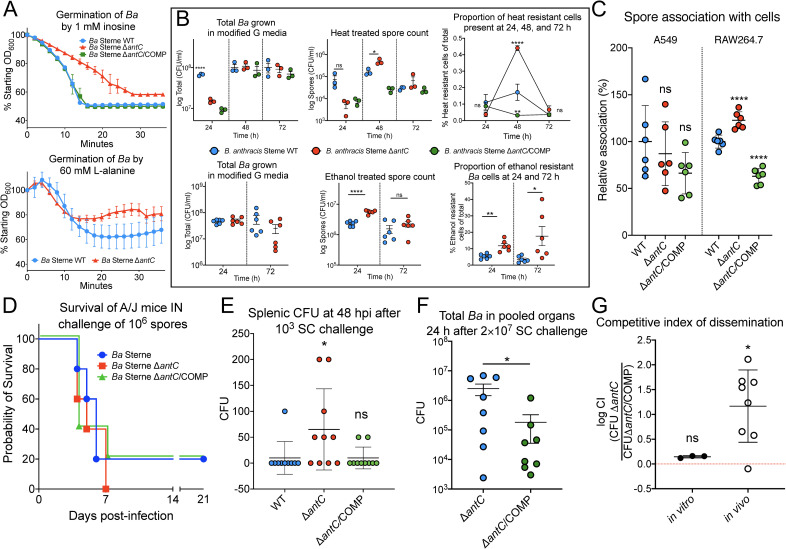
Fig 3. Anthrose deficiency affects B. anthracis physiology and the pathogenesis of anthrax.
(A) Ba germination in response to 1 mM inosine as germinant (top) and 60 mM L-alanine (bottom). The experiment was carried out in triplicate for each strain. The OD600 read every 2 minutes for 1 hour, and data are presented as percent of starting OD600. The symbols represent the mean, and the vertical bars are the standard deviation of the mean at the time points. (B) Sporulation of WT Sterne compared to the ΔantC and ΔantC/COMP strain as indicated after growth in modified G sporulation media at 24, 48, or 72 hours. The standard error of the mean of 3 heat treatments (top panel) or 6 ethanol treatments per strain are shown (bottom panel). (C) Spore internalization assay using human lung epithelial cell line A549 and mouse macrophage cell line RAW264.7 after infection of spores at an MOI of 10:1. Numbers are internalized spores as a percentage of total spores determined by dilution plating of inoculum and cell lysates. Then the percentages were normalized to WT Ba Sterne to obtain relative internalization %. (D) Survival of A/J following intranasal instillation of A/J mice with 106 spores of the indicated strain. (E) In a predetermined endpoint study, mice were infected by the subcutaneous route with 1,000 spores, and spleens were collected 48 hours postinfection. Each dot represents data from a single mouse with mean and standard deviation shown. p-Values were calculated by comparing Sterne (blue dots) to ΔantC (red dots) and ΔantC/COMP (green dots). Splenic bacterial burdens were low, but the levels of ΔantC mutant were significantly higher than wild-type and the complemented mutant as calculated by 1-way ANOVA. (F) Total bacterial organ burden of each strain from 8/10 mice challenged with 2 × 10⁷ total spores from the CI study. The means and SEM are shown with significance tested by the Student t test. (G) CI values were log transformed, and the standard deviation is shown. The Wilcoxon signed rank test was used to determine the significance of CI difference from 1. *p ≤ 0.05; **p ≤ 0.01; ***p ≤ 0.001; ****p ≤ 0.0001; ns = not significant. The data underlying Fig 3A–3G can be found in S1 Data. CI, competitive index; IN, intranasal challenge; MOI, multiplicity of infection; SC, subcutaneous challenge; WT, wild-type.

