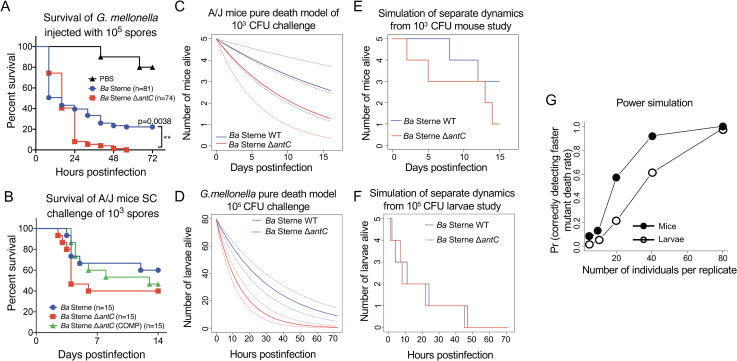
Fig 4. Alternate animal models and pure death process simulations coalesce at increased sample sizes.
(A) Subcutaneous infection of A/J mice with 1,000 spores of the indicated strains shows the consistent faster TTD and increased lethality of the ΔantC mutant. Data are from 3 independent experiments and 15 challenge mice. (B) Survival of G. mellonella infected with 105 spores of Ba ΔantC spores (red squares and line) was significantly different than the Ba Sterne wild-type challenged larvae (blue circles and line) as determined by the Mantel–Cox log-rank test. **p < 0.005; *p < 0.05. (C) Plot of the average estimated loss rates in the 1,000 CFU subcutaneous mouse challenge for each strain under the “Separate dynamics model.” (D) Plot of the average estimated loss rates in the 105 CFU G. mellonela injection challenge for each strain under the “Separate dynamics model.” (E) Simulation of 1,000 CFU dynamics using small sample sizes over the course of a typical animal. (F) Simulation of G. mellonella death dynamics using small sample sizes. (G) Number of animals per replicate versus the proportion of correctly calling the “Separate dynamics model” using the mouse dynamics (black circles) and the larva dynamics (white circles). The data underlying Fig 4A–4G can be found in S1 Data. CFU, colony-forming unit; SC, subcutaneous challenge; TTD, time to death.

