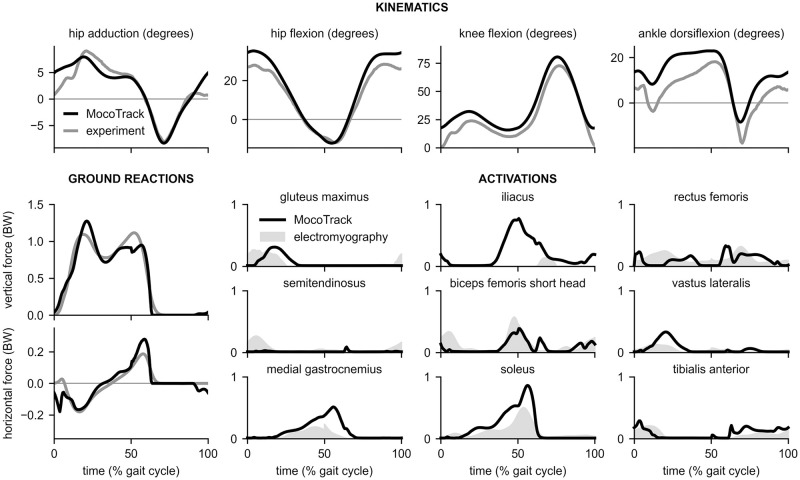
Fig 8. Tracking 3-D experimental motion data.
Top: MocoTrack produced kinematics (black) that tracked experimental data (gray). Left: MocoTrack produced sagittal plane ground reaction forces (black) whose timing matched that of experimentally-measured ground reaction forces (gray). However, the magnitude in the first peak of the vertical ground reaction force was overestimated. Right: Similar to MocoInverse, MocoTrack produced muscle activations (black) that matched the timing of electromyography measurements (gray). Electromyography for gluteus maximus and iliacus comes from Perry and Burnfield [68]; electromyography for all other muscles come from Rajagopal et al. [59] and signals were again normalized such that their peak matched the peak of the MocoInverse activations to be consistent with Fig 7.

