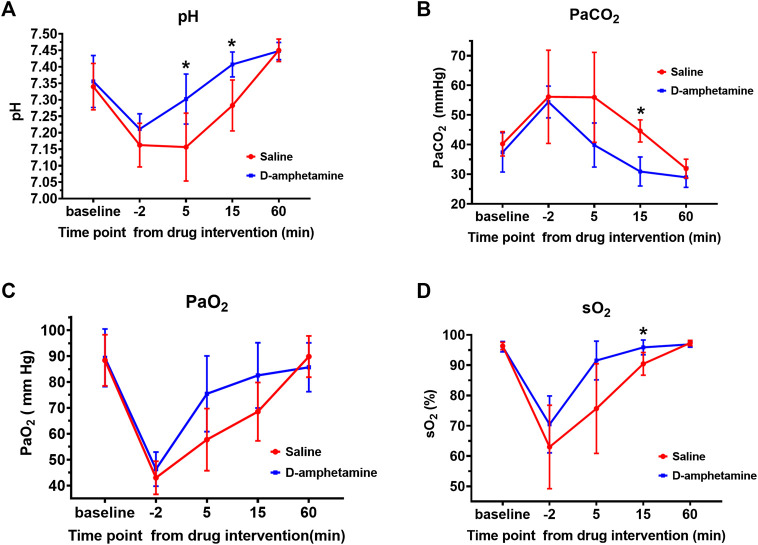
FIGURE 3.
Arterial blood gas values after fentanyl (55 µg/kg, IV) followed by d-amphetamine (blue, 3 mg/kg, IV) or saline (red). Measures included (A) pH (B) the partial pressure of carbon dioxide (PaCO2) (C) the partial pressure of oxygen (PaO2), and (D) the percent oxygen saturation (sO2). Time points were defined from the start of the infusion of d-amphetamine or saline (t = 0). Blood was drawn for analysis at baseline, the end of the fentanyl infusion (t = −2 min), and at 5, 15, and 60 min after the d-amphetamine or saline infusion. *p < 0.05, significance was determined by a mixed model two-way, repeated measures ANOVA with a Sidak’s multiple comparisons post-hoc analysis. Points are mean ± SD from n = 9 rats.

