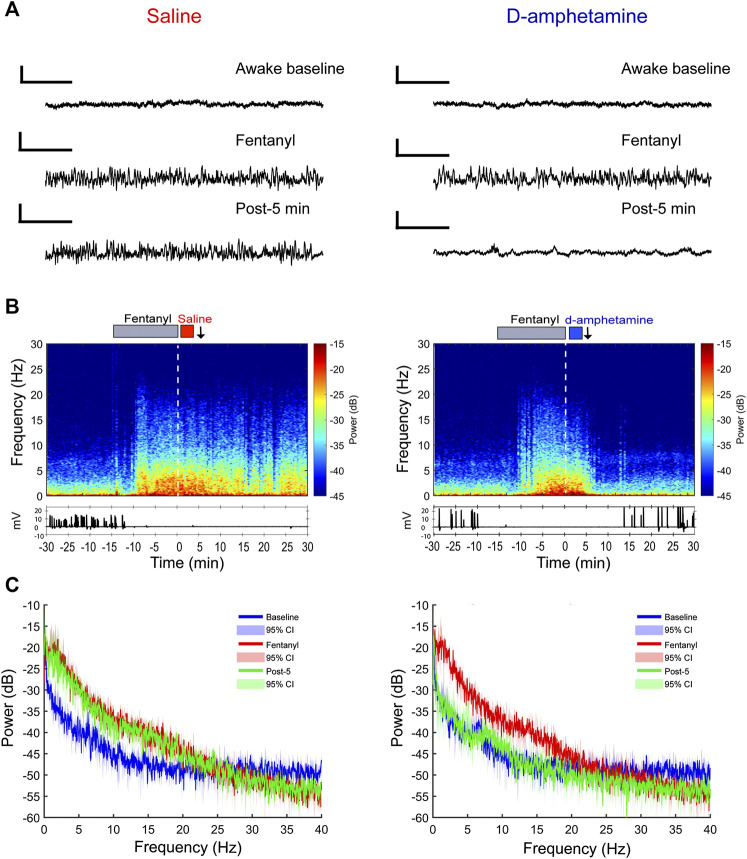
FIGURE 4.
Prelimbic cortical local field potential recordings show a faster return of consciousness when rats receive d-amphetamine (3 mg/kg, IV) rather than saline after high-dose fentanyl (55 µg/kg, IV). (A) Sample raw waveforms from an individual animal during the awake baseline, during the fentanyl infusion, and 5 min after saline or d-amphetamine was administered. (B) Example spectrograms computed for an individual rat with the EMG waveform below. The gray bar above depicts the duration of the fentanyl infusion (15 min). The red bar indicates the saline infusion and the blue bar indicates the d-amphetamine infusion. The white dotted line represents t = 0 time point. The black arrows indicate the post-5-min time point at which raw waveforms and power spectral density (PSD) plots are shown above and below in parts (A) and (C), respectively. (C) Group PSD plots computed from local field potential recordings taken during the awake baseline (blue), the end of the fentanyl infusion (red, t = −2 min), and 5 min after the start of the saline or d-amphetamine infusion (green, t = 5 min). Lines represent the median power and shaded areas represent the 95% confidence intervals. n = 3 rats.

