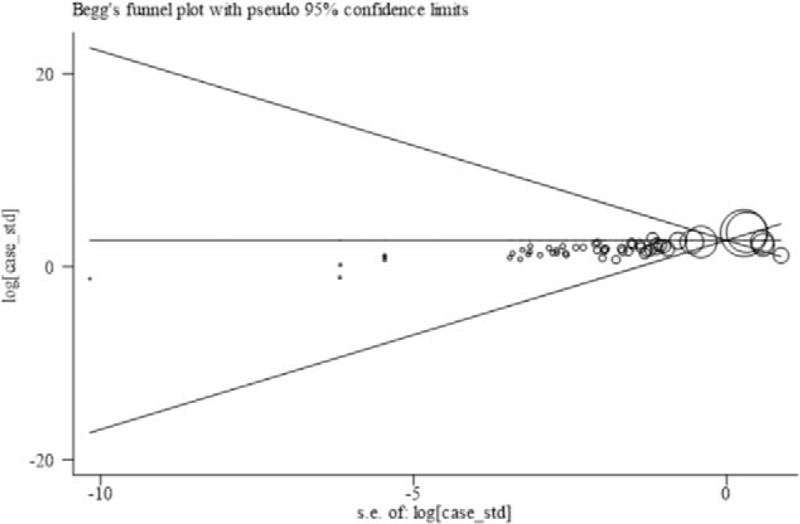
Figure 11.

Funnel plot of publishing bias. The publication bias of this study used the Stata 15 software for data processing, the data in the literature was represented by SMD, the intervention group SMD, the control group SMD and the intervention group number, the control group number were input, and the Begg method was used for analysis, continuous correction z = 0.73, continuous correction P = .468 > 0.05, indicating that the publication bias is not statistically significant.
