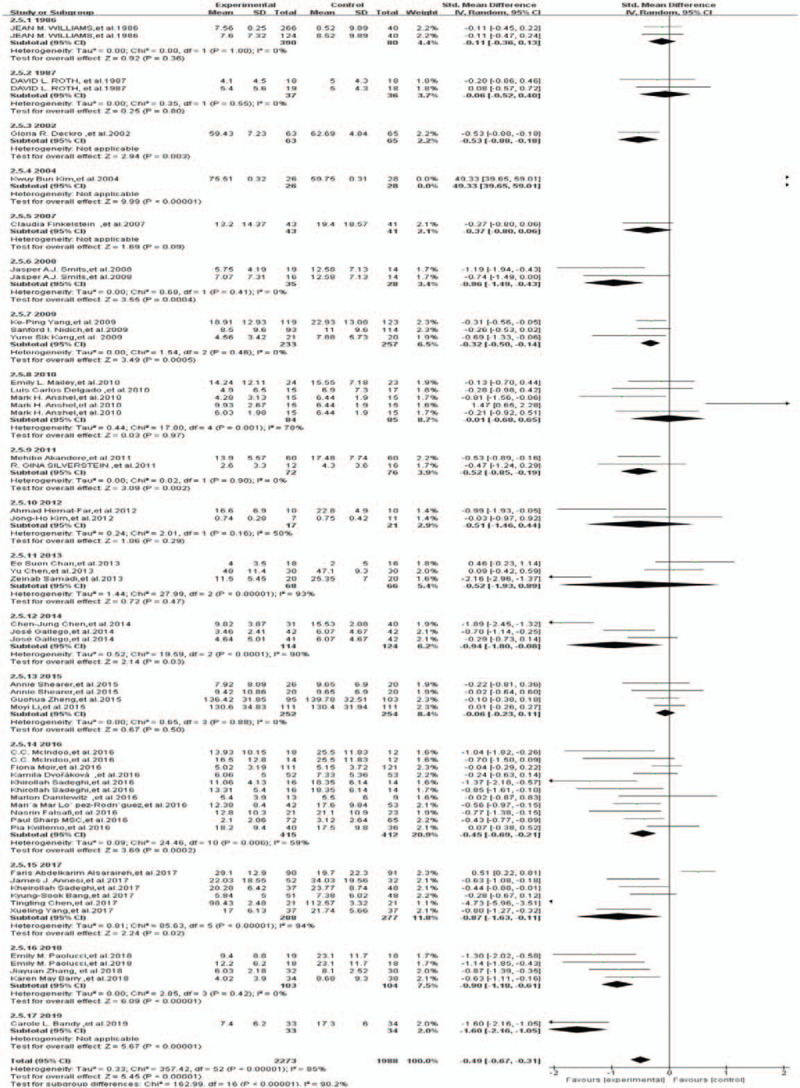
Figure 9.

Forest plot for subgroup analysis of published years. Using different published years as control variables for subgroup analysis, the results showed that 2002 [Z = 2.94, P = .003], 2004 [Z = 9.99, P<<.001], 2008 [Z = 3.55, P = .0004)], 2009 [Z = 3.49, P = .0005], 2011 [Z = 3.09, P = .002], 2014 [Z = 2.14, P = .03], 2016 [Z = 3.69, P = .0002], 2017 [Z = 2.24, P = .02], 2018 [Z = 6.09, P<.0001], 2019 [Z = 5.67, P<.0001] were significant. After combining the effect values [SMD = −0.49, 95%CI (−0.67, −0.31), P<.001, I2 = 85%], indicating that the published years is one of the factors of heterogeneity in this study.
