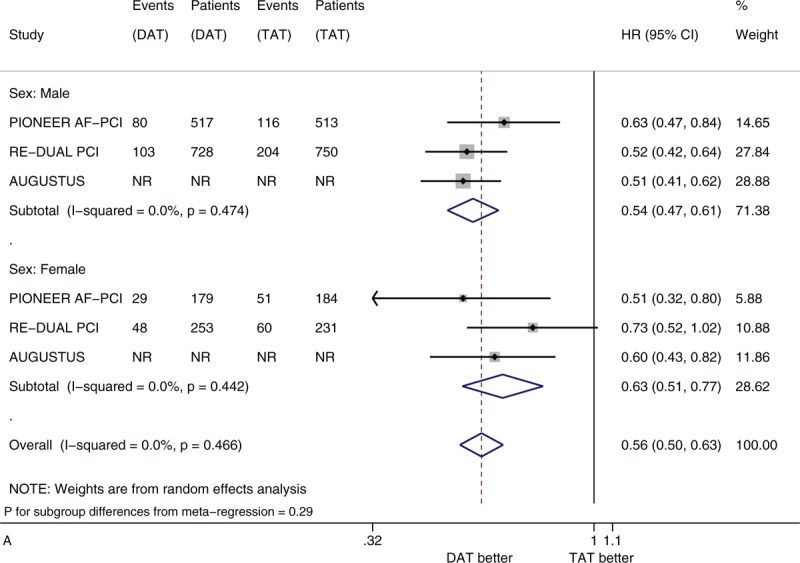
Figure 2.

(A) Forest plot of meta-analysis on clinically significant bleeding, stratified by sex. (B) Forest plot of meta-analysis on clinically significant bleeding, stratified by age. (C) Forest plot of meta-analysis on clinically significant bleeding, stratified by race. (D) Forest plot of meta-analysis on clinically significant bleeding, stratified by history of diabetes. (E) Forest plot of meta-analysis on clinically significant bleeding, stratified by type of P2Y12 inhibitor.
