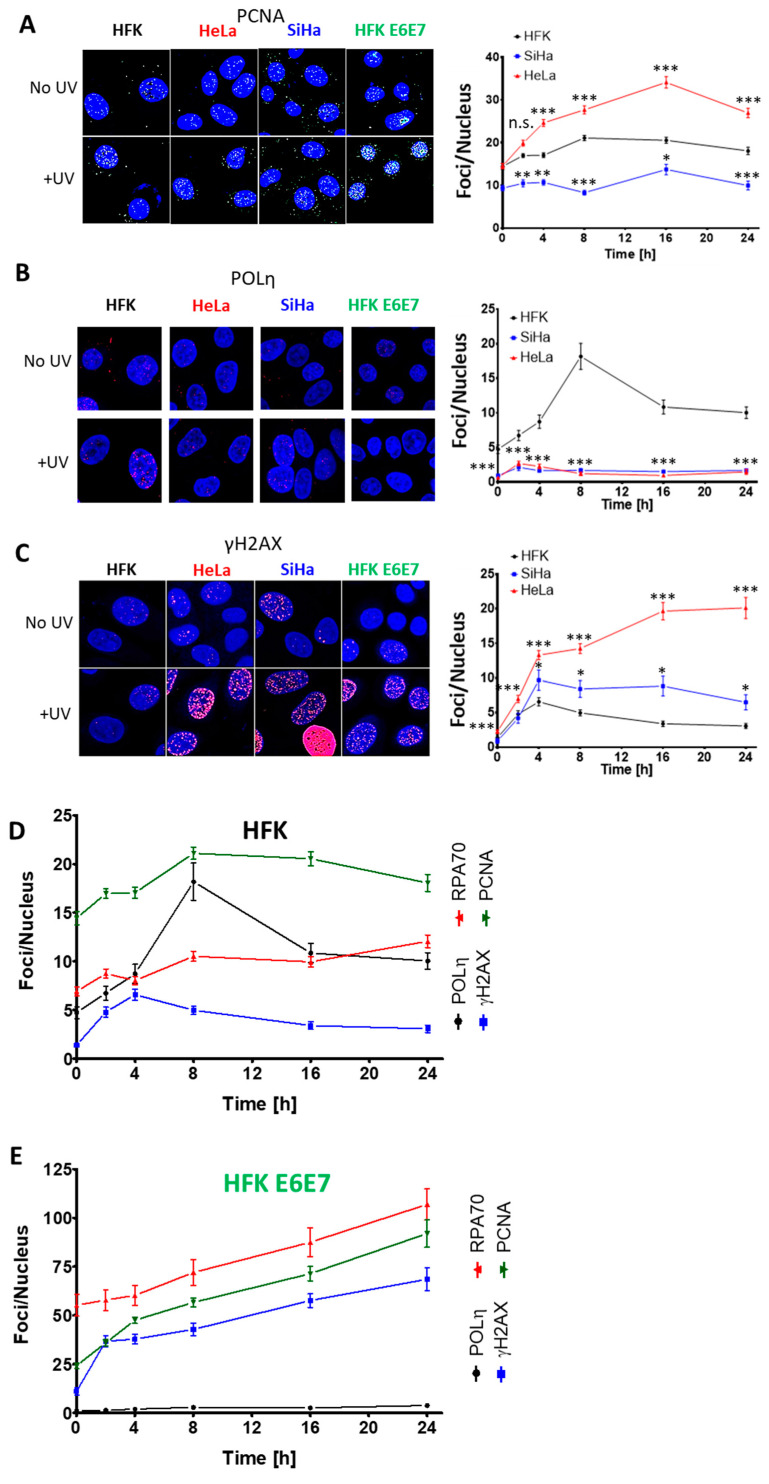
Figure 5.
HPV Oncogenes Impair the TLS Response to UV. Representative immunofluorescence microscopy images and average foci per cell of (A) PCNA (images at 16 h post UV), (B) POLη (images at 8 h post UV) and (C) γH2AX (images at 24 h post UV) in HFKs (LXSN), HFK E6E7, SiHa and HeLa cell lines with and without UV exposure. Black data points and lines mark HFKs. Red data points and lines denote HeLa cells. (D–E) Temporal comparison of POLη (black), RPA70 (red), PCNA (green) and γH2AX foci (blue) after UV treatment for (D) HFK and (E) HFK E6E7 cells. All data are mean ± SEM. p-Value annotation: * denotes p < 0.05, *** p < 0.001, student’s t-test. At least 429 nuclei were counted over three (PCNA) or four (γH2AX, RPA70, POLη) independent experiments.

