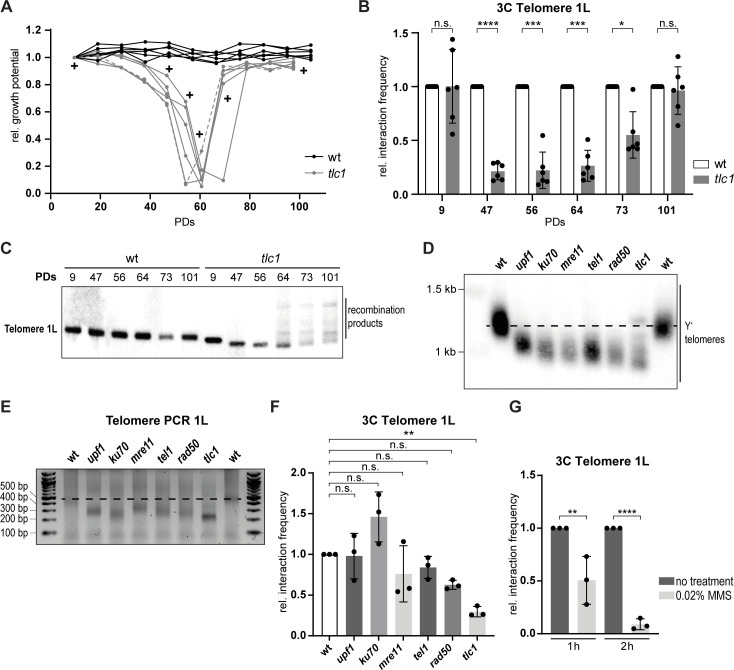
Fig 2. Telomere 1L opens during replicative senescence.
A. The relative growth potential of 6 independent wt and tlc1 cultures was followed over ~100 PDs. Samples for Telo-3C were collected at the indicated time points (+). We defined PD 0 as the time the senescence curve was started in liquid media from the germinated spore colony. The dashed grey line indicates the clone that was used for telomere length analysis (see Figs 2C and S2A). B. Telo-3C analysis during the time course shown in Fig 2A. The relative interaction frequencies between primers P5 and P6 (Fig 1B) are shown. All interaction frequencies were normalized to a control qPCR product. Relative interaction frequencies were calculated by setting the normalized interaction frequency of the wt of the respective day to 1. Population doubling values that were used for Telo-3C correspond to those used in the senescence curve (Fig 2A) (i.e. from 24-hour saturated cultures). Mean +/- SD of 6 different clones in 3 independent experiments. Adjusted p-values were obtained from two-way ANOVA with Sidak’s multiple ikcomparisons test (*p ≤ 0.05, ***p ≤ 0.001, ****p ≤ 0.0001, n.s., not significant). C. Southern blot for telomere 1L on genomic DNA digested with SalI using a specific PCR product labeled with 32P as a probe. One representative sample per genotype is shown (dashed grey line in Fig 2A). Population doubling values that were used for Southern blotting correspond to those used in the senescence curve (Fig 2A) (i.e. from 24-hour saturated cultures). D. Southern blot for all telomeres on XhoI-digested genomic DNA from the indicated deletion mutants using a radio-labeled (TG)n-repeat containing vector fragment as a probe. The tlc1 mutant was analyzed at ~PD 40 as calculated in Fig 2A. A representative sample for each genotype is shown. The dashed line indicates wt telomere length. E. Telomere PCR for the length of telomere 1L in the depicted mutants from the genomic DNA used in Fig 2D. The tlc1 mutant was analyzed at ~PD 40 as calculated in Fig 2A. The dashed line indicates the wt telomere length. F. Telo-3C analysis of the displayed mutants. The tlc1 mutant was analyzed at ~PD 40 as calculated in Fig 2A. The interaction frequencies between primers P5 and P6 are shown. All interaction frequencies were normalized to a control qPCR product. Relative interaction frequencies were calculated by setting the normalized interaction frequency of the wt to 1. Mean +/- SD of 3 independent experiments. Adjusted p-values were obtained from one-way ANOVA with Dunnett’s multiple comparisons test (**p ≤ 0.01, n.s., not significant). G. Telo-3C analysis of wt cells after 1 h and 2 h of MMS treatment (0.02%). The interaction frequencies between primers P5 and P6 are shown. All interaction frequencies were normalized to a control qPCR product. Relative interaction frequencies were calculated by setting the normalized interaction frequency of the untreated samples to 1. Mean +/- SD of 3 independent experiments. Adjusted p-values were obtained from two-way ANOVA with Sidak’s multiple comparisons test (**p ≤ 0.01, ****p ≤ 0.0001). PDs = population doublings.

