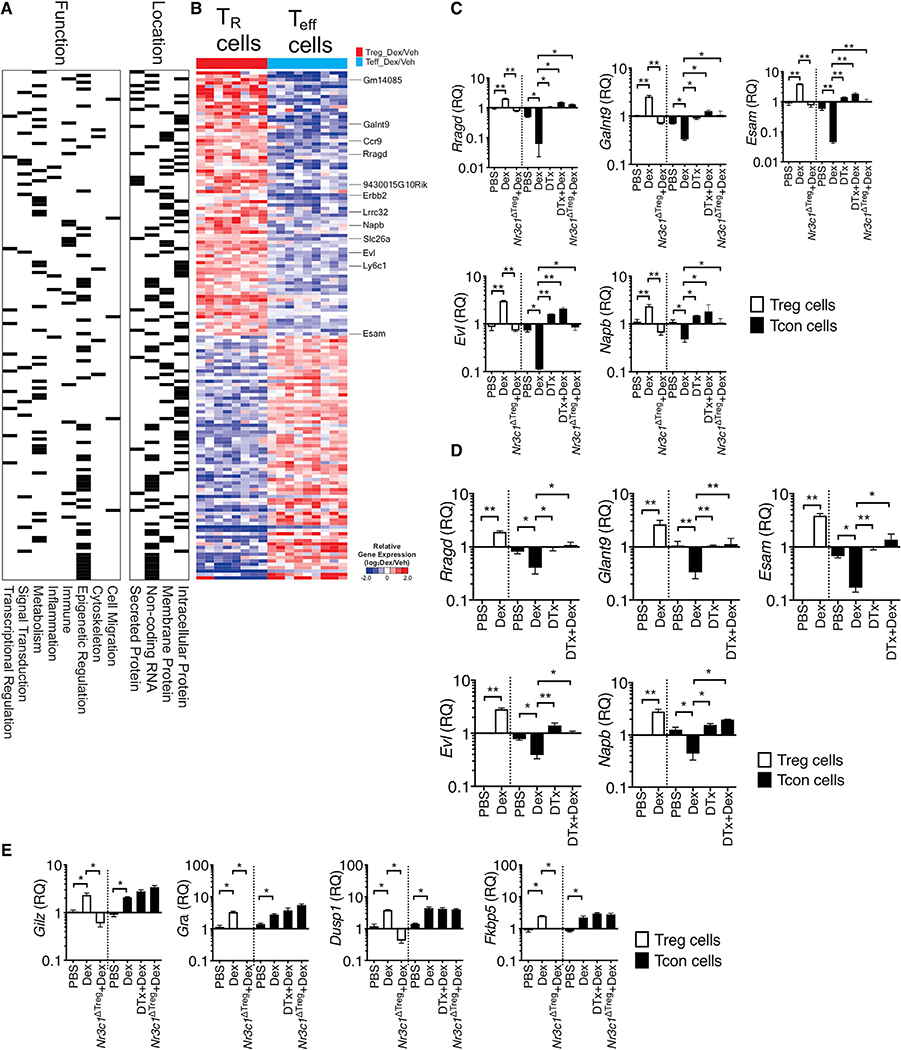
Figure 4. Differentially Expressed Genes between Treg Cells and T Effector following Dex Treatment.
(A, B, and D) Foxp3GFP or Foxp3DTR mice were induced for allergic inflammation, treated with vehicle or Dex as described above. At sacrifice, Foxp3+ Treg and effector CD4+ T cells were flow cytometry sorted from the lung tissues.
(A and B) RNA-seq analysis was performed (n = 3 each group). Based on the function and location, gene sets were marked for each category.
(B) Heatmap shows expression of genes (|fold change| > 2, p < 0.001 in Treg cells versus effector cells).
(C–E) RNA was isolated from the sorted cells and evaluated for gene expression by qPCR. Expression of the indicated genes was normalized to the housekeeping Gapdh gene, and relative quantification (RQ) value was calculated.
(C and E) Foxp3DTR or Treg-cell-specific Nr3c1−/− mice induced for EAE and treated with Dex or DTx + Dex were sacrificed as above. Treg cells and effector CD4+ T cells were flow cytometry sorted from the CNS tissues, and relative expression of the indicated genes was determined by qPCR. Data are the mean ± SD of three independent experiments. *p < 0.05; **p < 0.01, as determined by Kruskal-Wallis nonparametric test. Please also see Figure S5.

