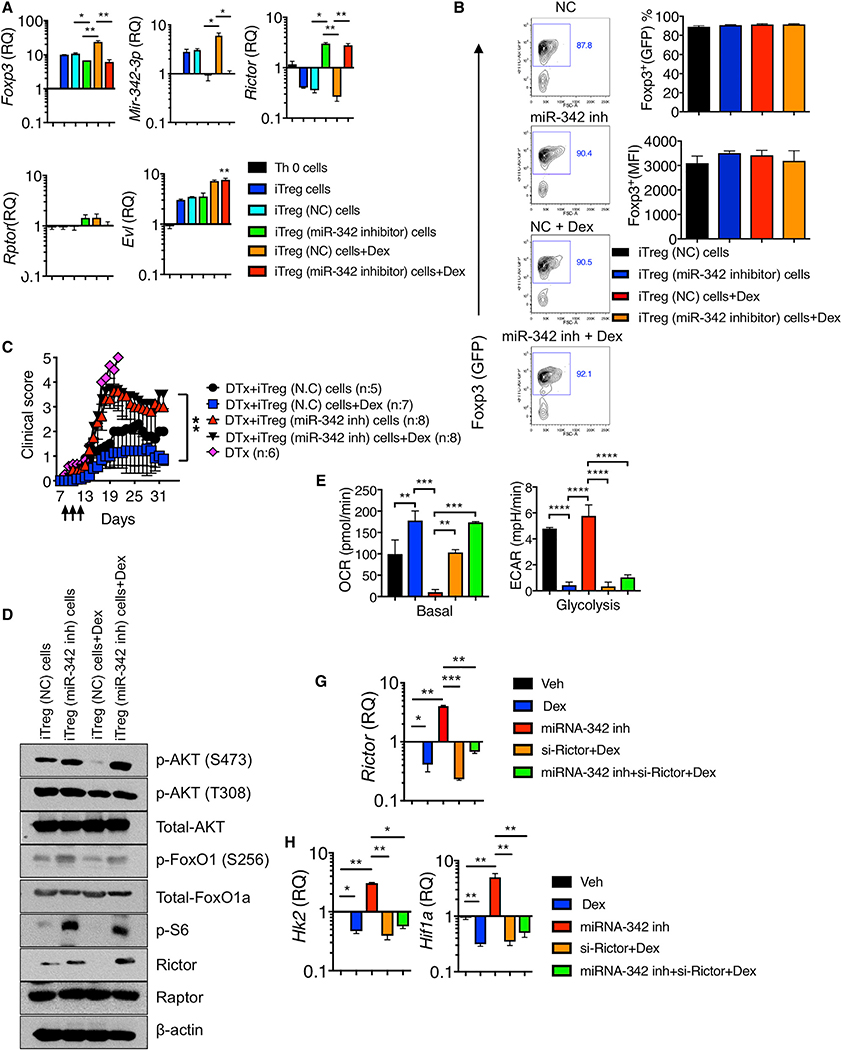
Figure 6. miR-342–3p Controls Treg Functions and Metabolism.
(A and B) Naive CD4+ T cells isolated from Foxp3GFP mice were nucleofected with control (NC) or miR-342–3p specific antisense oligonucleotide inhibitor and then activated in vitro under Th0 or iTreg cell conditions with or without Dex for 72 h.
(A) Foxp3, miR-342–3p, Rictor, Rptor, and Evl expression were determined by qPCR analysis.
(B) Foxp3 (GFP) expression was determined by flow cytometry analysis.
(C) Foxp3DTR mice were induced for EAE and treated with DTx day 7 post induction. 2×10⁶ control iTreg cells or miR-342–3p inhibitor treated iTreg cells as above were transferred on day 7. Dex treatment was performed on days 9 through 11. The mice were daily monitored and scored for clinical diseases. N.C (n = 5), Dex (n = 7), miR-342–3p inh (n = 8), and miR-342–3p inh + Dex (n = 8) from two to three independent experiments.
(D) Expression and phosphorylation of the indicated proteins in control or miR-342–3p inhibitor treated iTreg cells with or without Dex were determined by immuno blot analysis.
(E–G) Naive CD4+ T cells nucleofected with the indicated inhibitors or si-Rictor were stimulated under iTreg condition with or without Dex for 72 h. (E) OCR and EACR measurement. Quantitation of basal respiration and glycolysis are shown. n = 5 each group. (F) qPCR analysis of Rictor expression. (G) qPCR analysis of Hk2 and Hif1a expression. Data are the mean ± SD of two to three independent experiments. *p < 0.05; **p < 0.01; ***p < 0.001; ****p < 0.0001, as determined by Kruskal-Wallis nonparametric test. Please also see Figure S7.

