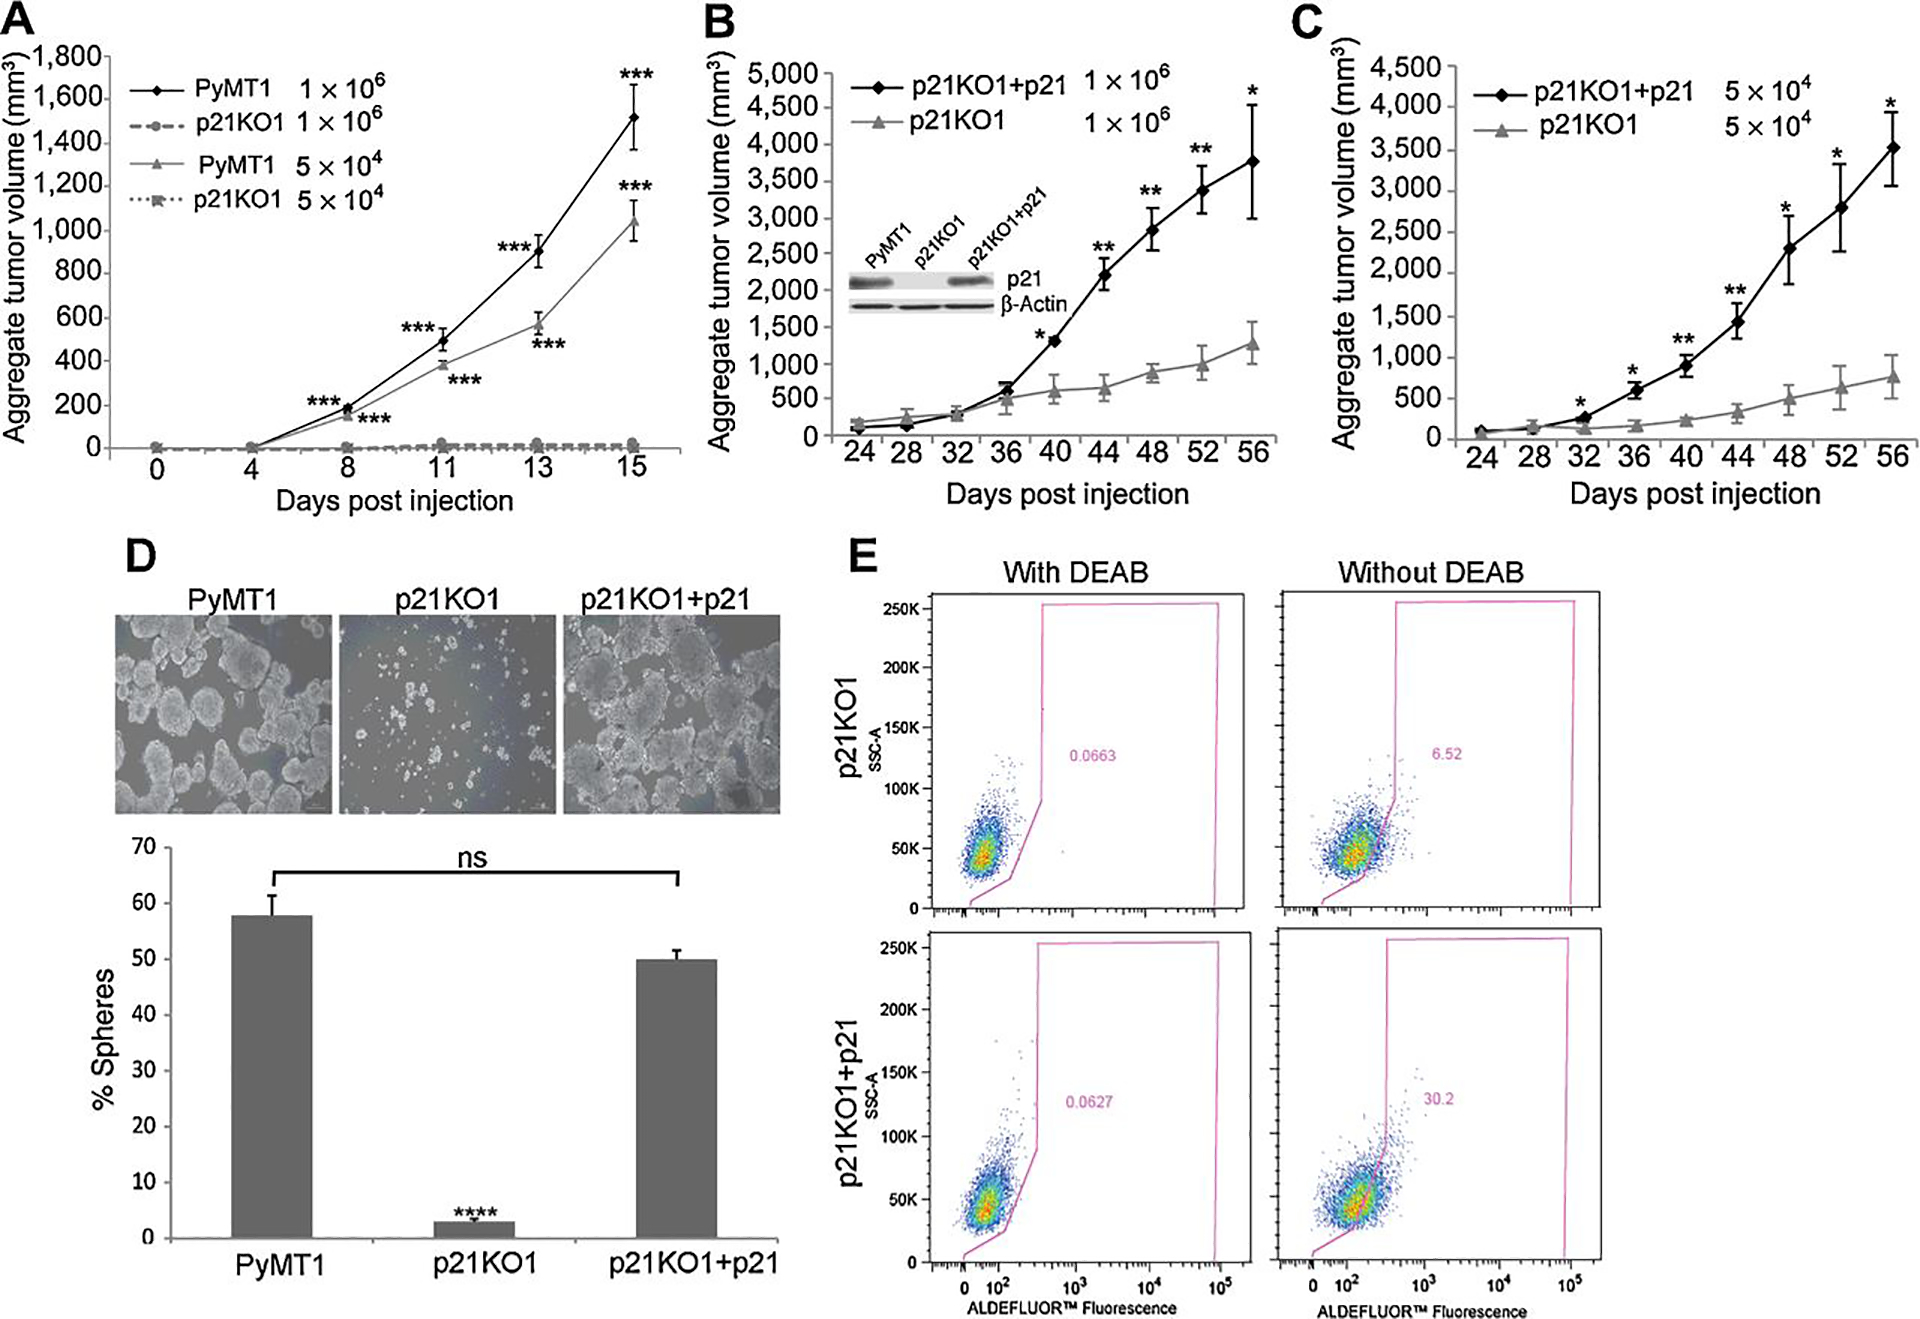
Figure 2. p21 knockout in PyMT cells inhibits tumor initiating potential that can be rescued by p21 overexpression in p21KO cells.

(A) PyMT1 tumor cells were compared to p21KO1 cells for ability to form primary tumors following fat pad implantation of 1×10⁶ and 5×10⁴ cells in two mammary sites of 6 athymic nude mice. (B-C) p21KO1 cells in which p21 was overexpressed (p21KO1+p21) were compared to p21KO1 cells expressing control vector (immunoblot in B shows p21 rescue). Each of these cell lines were implanted in two sites of the mammary fat pads of 6 athymic nude mice at 1×10⁶ and (B) 5×10⁴ (C) cells per site. Mammary tumor growth was measured as aggregate tumor volume (sum of two tumors per mouse) over a period of 15 days for (A) and 56 days for (B-C). Results are shown as mean aggregate tumor volume ± SEM. Differences in aggregate tumor volume at each cell dilution and time point between PyMT1 and p21KO1 (A) and p21KO1 and p21KO1+p21 (B-C) were determined by two-tail non-parametric t-test, and were statistically significant (p<0.05). (D) PyMT1, p21KO1, p21KO+p21 cells were each tested for mammosphere formation in triplicate cultures. The percent of spheres is shown as mean ± SEM. Significant differences (p=0.0001) were observed between PyMT1 and p21KO1, but not between PyMT1 and p21KO1+p21 cells (ns). (D) p21KO1 and p21KO1+p21 cell lines were assessed for ALDH1 activity; p21KO1+p21 cells (bottom panels) showed 5 fold increase in the Aldelfuor-positive cell population as compared to p21KO1 cells (top panels). Left panels: Negative controls include cells treated with DEAB, an irreversible inhibitor of ALDH1.
