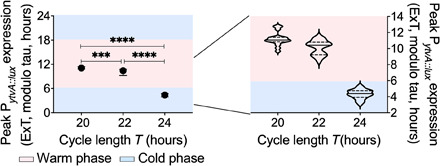
Fig. 4. Phase angle of entrainment in T cycles.

PytvA::lux was cultured under symmetrical temperature cycles [alternations between 25.5°C (50% of cycle) and 28.5°C (50% of cycle)] using different cycle lengths (T) [T20 (a 20-hour zeitgeber cycle): N = 17; T22 (a 22-hour zeitgeber cycle): N = 16; T24 (a 24-hour zeitgeber cycle): N = 26]. The phase [peak of luciferase expression; expressed as external time (ExT), where midnight is 0] shifted to a later phase with shorter temperature cycles. The blue shaded areas indicate the cold phase, and the pink shaded areas indicate the warm phase. The graph on the left shows median period with the interquartile range. The graph on the right is a violin plot of the same data. Phases observed in the different T cycles were compared using ordinary one-way ANOVA. All comparisons were significantly different from each other (****P < 0.0001, ***P = 0.0005).
