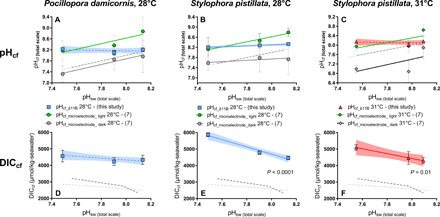
Fig. 6. pHcf and DICcf from boron proxies and pHcf from LIX measurements.

(A to C) Comparison between averages of boron-based pHcf (blue or red symbols) and microelectrode-derived pHcf in the light (open symbols) and in the dark (solid gray symbols) at the two temperature treatments for P. damicornis [(A) 28°C; no microelectrode pHcf data at 31°C] and S. pistillata [(B) 28°C and (C) 31°C]. LRs of pHcf_light (orange, 28°C; green, 31°C), pHcf_dark (black, 28°C; gray, 31°C), and pHcf_δ11B (blue, 28°C; red, 31°C) versus pH treatment. (D to F) DICcf data calculated from B/Ca and δ11B-derived pHcf for P. damicornis [(D) 28°C; no microelectrode pH data at 31°C] and S. pistillata [(E) 28°C and (F) 31°C]. Dashed gray lines represent 1:1 ratio of pHcf:pHsw for comparison to observed trends (28°C, dark; 31°C, light). Error bars are given in SEM and envelopes for the regressions represent 95% confidence interval.
