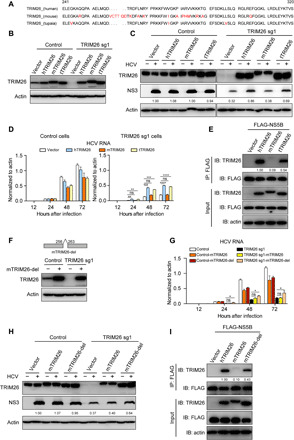
Fig. 5. TRIM26 determines the HCV species tropism.

(A) Alignment of TRIM26 protein of different species. (B) Western blot analysis of reconstituted TRIM26 of different species in control and Huh7-TRIM26 knockdown cells. (C and D) The reconstituted TRIM26 cells were infected with HCVcc at MOI of 0.1 for the indicated time points. HCV NS3 protein expression (C) and RNA level (D) were analyzed at 48 hours after infection. (E) Huh7-TRIM26 knockdown cells reconstituted with hTRIM26, mTRIM26, and tTRIM26 were transfected with plasmids expressing FLAG-tagged NS5B. The cell lysates were immunoprecipitated with anti-FLAG antibody and then immunoblotted by indicated antibodies. (F) Western blot analysis of reconstituted mTRIM26-del expression in control cells and Huh7-TRIM26 knockdown cells. (G and H) The reconstituted TRIM26 cells were infected with HCVcc at MOI of 0.1 for the indicated time points. HCV RNA level (G) and NS3 protein expression (H) at 48 hours after infection were analyzed. (I) Huh7-TRIM26 knockdown cells reconstituted with hTRIM26, mTRIM26, or mTRIM26-del were transfected with plasmids expressing FLAG-tagged NS5B. The cell lysates were immunoprecipitated with anti-FLAG antibody and then immunoblotted by indicated antibodies. The error bars represent SDs from two independent experiments. One-way ANOVA was used for statistical analysis. ns, P > 0.05; *P < 0.05; **P < 0.01; ***P < 0.001; ****P < 0.0001. The protein levels were quantified by ImageJ, normalized against internal actin, and expressed as relative to control (C and H) or normalized against TRIM26 input protein level and expressed as values relative to immunoprecipitated FLAG-tagged protein level (E and I).
