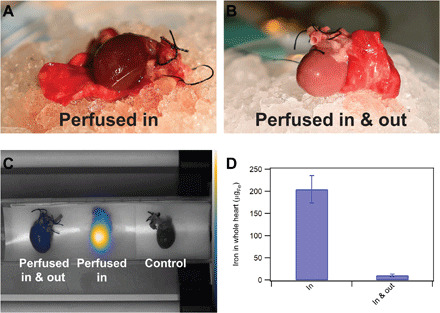
Fig. 4. Evaluation of heart perfusion with mCPA using MPI.

(A) Representative photo of a heart well perfused with mCPA at 1 mgFe/ml. (B) Representative photo of a heart perfused in with mCPA at 1 mgFe/ml and then out with Custodiol HTK. (C) Co-registered image of hearts with their respective MPI signals, including (left to right) heart perfused in with mCPA and then out with Custodiol HTK, heart perfused in with mCPA, and control heart perfused with Custodiol HTK. (D) SPION iron mass in whole hearts determined from quantification of the MPI signal for n = 3 hearts perfused in and n = 4 hearts perfused in with mCPA and out with Custodiol HTK. Photo credit: Edward Staples, University of Florida.
