
Fig. 1. Nanostructure and defects in iron oxide–oleic acid bulk supercrystalline nanocomposites.
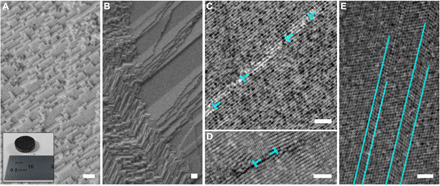
(A) Single supercrystal FCC nanostructure and bulk pellet after processing. Photo credit: Diletta Giuntini, Hamburg University of Technology. (B) Intersupercrystalline interface (high-angle grain boundary). (C) Low-angle grain boundary. (D) Frank partial. (E) Twins. (A) and (B) are SEM micrographs, (C) and (E) are TEM micrographs, and (D) is a STEM high-angle annular dark field micrograph. The FCC superlattice is visualized along the [] projection axis in (C) and (D), while along the axis in (E). Scale bars, 100 nm. The defects depicted here are detected regardless of cross-linking.