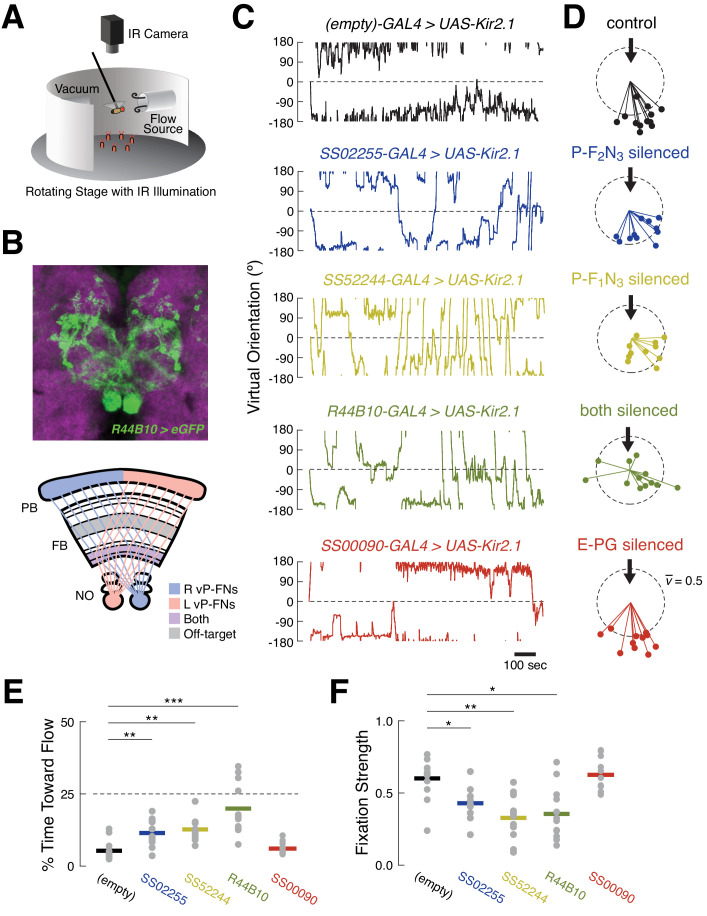
Figure 6. Silencing ventral P-FNs disrupts orientation to airflow.
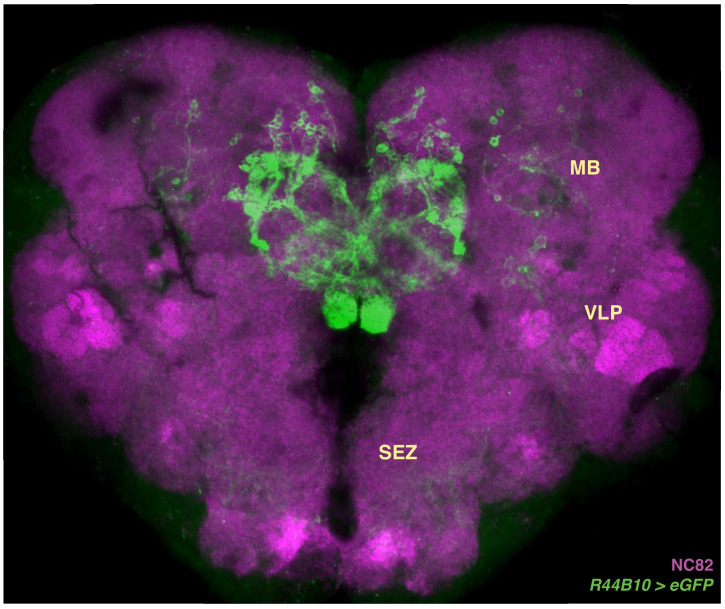
(A) Schematic of flight simulator arena. Rigidly tethered flying flies orient in closed-loop with an airflow stream. Infrared illumination is used to track wingbeat angles which drive airflow rotation. The arena was otherwise in darkness. Modified from Currier and Nagel, 2018. (B) Anatomy of R44B10-GAL4, a driver line that targets both P-F1N3 and P-F2N3. Top: maximum z-projection of R44B10 driving 10XUAS-Kir.21-eGFP (green). Neuropil in magenta. Bottom: schematic of CX neuropils labeled by R44B10-GAL4. Right-hemisphere ventral P-FNs (blue) target the right half of the PB, the entire FB, and the left NO. Left-hemisphere ventral P-FNs (red) target the left half of the PB, the entire FB, and the right NO. Neurons from both hemispheres target all columns of FB layers 1 and 2 (purple). R44B10-GAL4 also labels non-P-FN neurons in a FB layer (‘off target,’ gray). Whole-brain expression in Fig. S5. (C) Orientation over time for example flies of each genotype. Control flies (empty-GAL4 > UAS-Kir2.1, black) fixate orientations away from the airflow sources. This fixation is reduced in flies with P-F2N3 (blue), P-F1N3 (yellow), or both (dark green) silenced. Flies with E-PGs silenced (red) show control-like orientation behavior. The entire 20 min testing period is shown for each fly. Airflow emanated from 0° (dashed line). (D) Stick-and-ball plots of mean orientation (ball angle) and fixation strength (stick length) for each fly tested in the airflow orienting paradigm. Fixation strength is the length of the mean orientation vector, which is inversely proportional to circular variance (see Materials and methods). Dashed circle corresponds to fixation strength of 0.5. All but one control fly, and all E-PG-silenced flies, showed fixation strengths near or above this value, while ventral P-FN-silenced flies displayed smaller fixation strengths. Thick arrow signifies the position and direction of the airflow stimulus (0°). Colors as in (C). (E) Percentage of time each fly (gray dots) oriented toward the flow source (between +45° and −45°), as a function of genotype. Horizontal bars indicate cross-fly means, with colors as in (C). Dashed line indicates the expected value for random orienting (chance). **p<0.01; ***p<0.001 (rank-sum test). (F) Fixation strength (as illustrated in (D)) for each fly as a function of genotype. A value of 1 indicates perfect fixation. Plot details as in (E). *p<0.05; **p<0.01 (rank-sum test).


