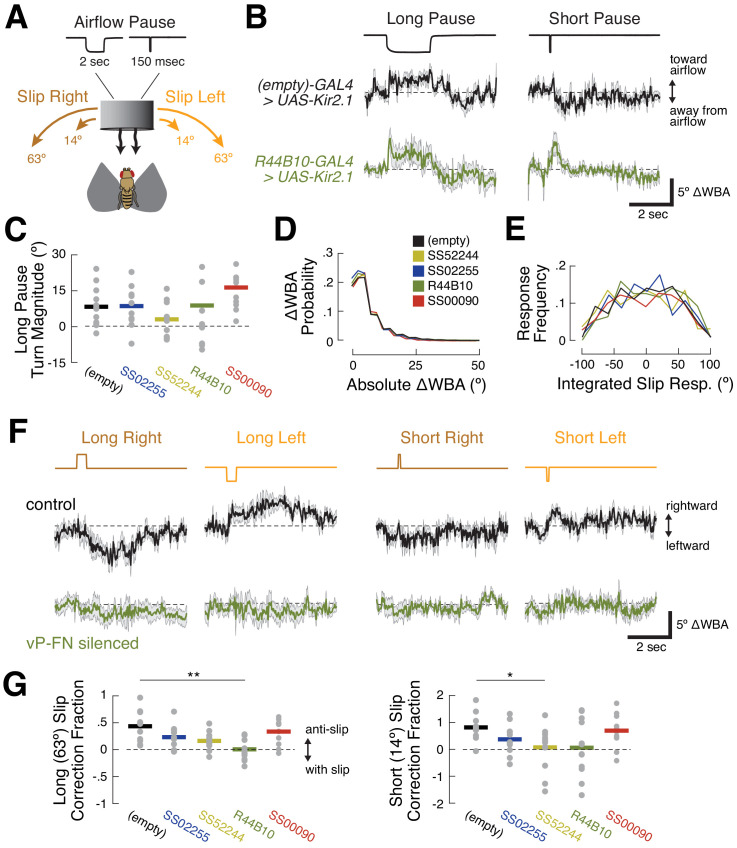
Figure 7. R44B10 neurons are required to convert airflow orientation changes into heading-appropriate turns.
(A) Stimulus manipulations. Six manipulations were presented pseudo-randomly every 20 s during closed-loop flight: long wind pause (2 s); short wind pause (150 msec); short (14.44°) and long (63.36°) rightward slip of virtual orientation; and short and long leftward slip of virtual orientation. Slip velocity was 144 °/sec. (B) Responses to long and short airflow pauses in control flies (empty-GAL4>UAS-Kir2.1, black) and ventral P-FN-silenced flies (R44B10-GAL4>UAS-Kir2.1, dark green). Traces show mean +/- SEM difference in wingbeat angles (ΔWBA), a proxy for intended turning, for 120 trials across 12 files (10 repetitions per fly). In this plot, positive ΔWBA values indicate turns toward the airflow source and negative ΔWBA values indicate turns away from the airflow source. Dashed line represents no turning. (C) Mean ΔWBA (integrated over 2 s) in response to a long airflow pause for each fly (gray dots) of each genotype. Horizontal bars indicate cross-fly means. Positive ΔWBA values represent turns toward the airflow source. All groups are statistically indistinguishable by rank-sum test. (D) Probability distributions of ΔWBA values for control (black), P-F1N3-silenced (gold), P-F2N3-silenced (dark blue), all ventral P-FN-silenced (dark green), and E-PG silenced (red) flies. The distributions are statistically indistinguishable by KS-test. (E) Probability distributions of integrated slip responses for each genotype (colors as in (D)). Slip responses are integrated over 5 s of slip stimulus, with both leftward (negative) and rightward (positive) slips included. The distributions are statistically indistinguishable by KS-test. (F) Responses to orientation slips in ventral P-FN-silenced flies (R44B10-GAL4>UAS-Kir2.1, dark green) and control flies (empty-GAL4>UAS-Kir2.1, black). Each trace represents the mean +/- SEM of 120 trials across 12 files (10 repetitions per fly). In this plot, positive ΔWBA values indicate rightward turns and negative ΔWBA values indicate leftward turns. Traces show cross-fly mean +/- SEM with colors as in (B). (G) Fraction of slip displacement corrected by each fly (gray dots) of each genotype in response to long (left) and short (right) slips. Values represent mean integrated slip response divided by negative slip magnitude. Positive values indicate ‘corrective’ turns in the opposite direction of the slip. A correction fraction of 1 indicates that a fly steered the airflow direction to be identical before and after a slip trial. Note differing Y-axis scales for each plot. *p<0.05; **p<0.01 (rank-sum test).

