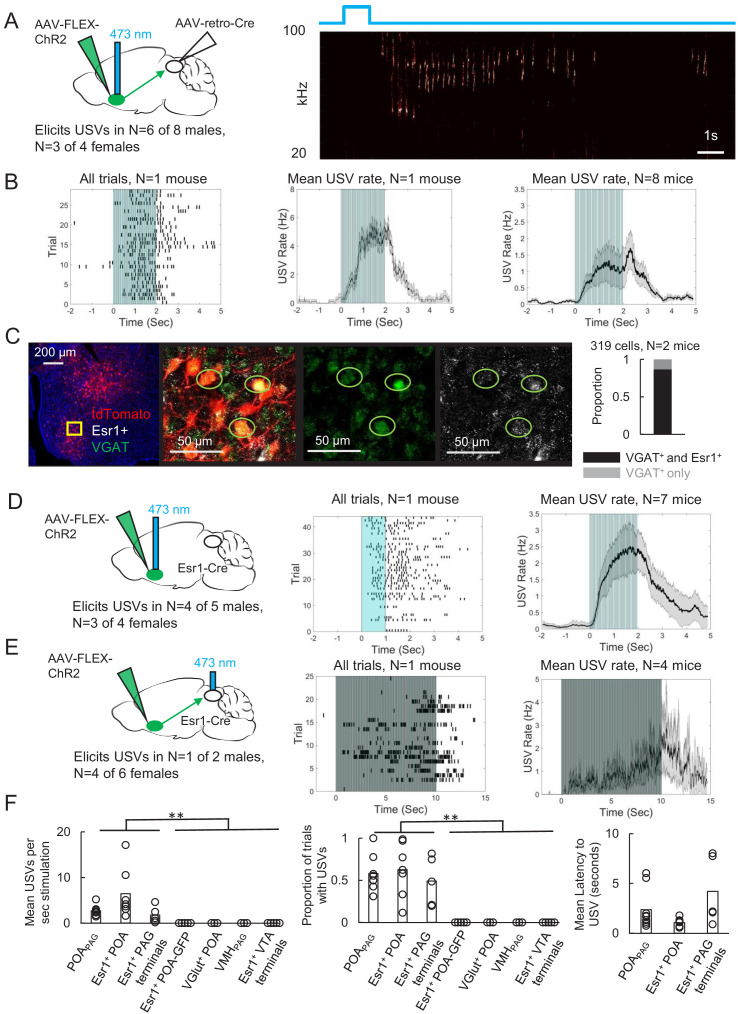
Figure 2. Activating periaqueductal gray (PAG)-projecting POA neurons elicits ultrasonic vocalizations (USVs) in the absence of social cues.
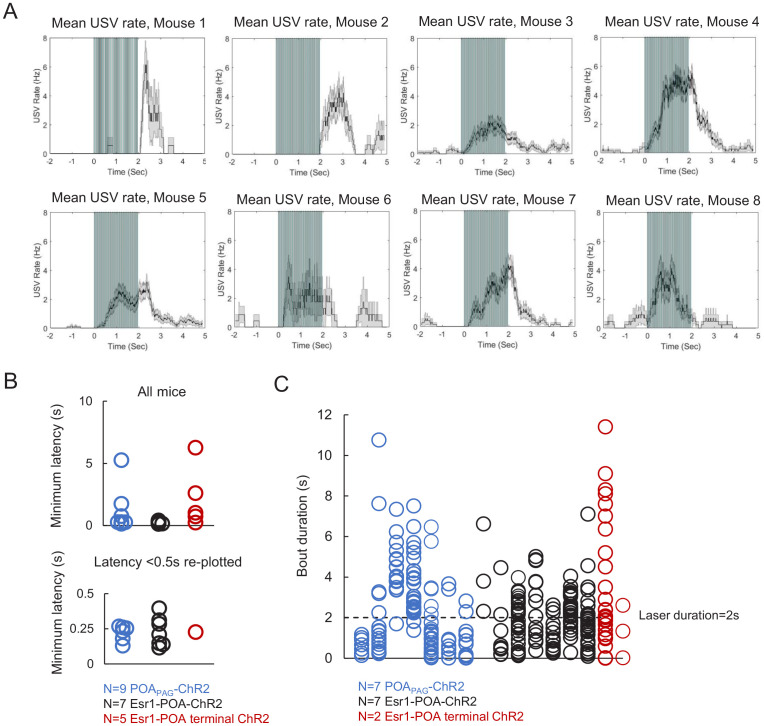
(A) (Left) Viral strategy to express ChR2 in POAPAG neurons. (Right) Example trial showing that optogenetic activation of POAPAG neurons elicits USV production in an isolated animal. (B) (Left) Raster plot shows USVs elicited in many trials in a representative mouse following optogenetic activation of POAPAG neurons. (Middle) Mean USV rate aligned to delivery of blue light pulses plotted for that same mouse. (Right) Mean USV rate plotted for N = 8 mice following optogenetic activation of POAPAG neurons. Please note that one mouse in which USVs were elicited by optogenetic stimuli that did not include the 2s-long, 10 Hz stimulus is excluded from the summary analysis shown in the right-most panel. Gray shading above and below the mean in the middle and right panels represents S.E.M. See also Figure 2—figure supplement 1. (C) Representative confocal image and quantification of in situ hybridization performed on POAPAG neurons (tdTomato, red), showing overlap with Esr1 (white) and VGAT (green). DAPI is blue, N = 2 mice. (D) (Left) Viral strategy used to express ChR2 in Esr1+ POA neurons. (Middle) Raster plot shows USVs elicited in many trials in a representative mouse following optogenetic activation of Esr1+ POA neurons. (Right) Mean USV rate plotted for N = 7 mice following optogenetic activation of Esr1+ POA neurons. Gray shading above and below the mean represents S.E.M. (E) Same as (D), for experiments in which the axon terminals of Esr1+ POA neurons were optogenetically activated within the PAG. Data shown for stimulation with10s-long, 20 Hz blue light pulses. Please note that one mouse in which USVs were elicited by optogenetic stimuli that did not include the 10s-long, 20 Hz stimulus is excluded from the summary analysis shown in the right-most panel. (F) Summary plots show mean number of USVs per second of optogenetic stimulation (left, p=0.0013, one-way ANOVA between all groups, with post-hoc t-tests showing that each experimental condition was significantly different from control conditions at p<0.01), mean number of optogenetic trials with USVs (middle, p=1.8E-6, one-way ANOVA between all groups, with post-hoc t-tests showing that each experimental condition was significantly different from control conditions at p<0.01), and mean latency from onset of optogenetic stimulus to onset of first USV (right) for mice in which optogenetic stimulation was applied to POAPAG neurons (N = 9 mice), Esr1+ POA neurons (N = 7 mice), Esr1+ POA axon terminals within the PAG (N = 5 mice), GFP-expressing Esr1+ POA neurons (N = 5 mice), VGlut+ POA neurons (N = 3 mice), VMHPAG neurons (N = 3), and Esr1+ POA axon terminals within the ventral tegmental area (VTA) (N = 4 mice). See also Figure 2—figure supplements 1–3 and Figure 2—source data 1.


