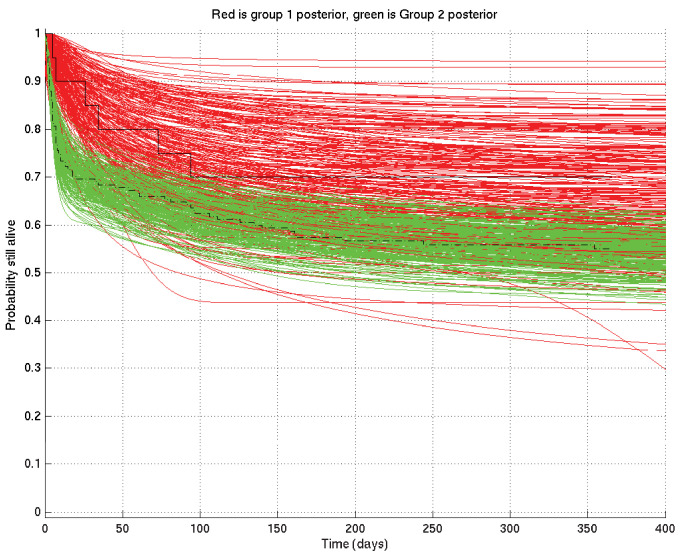
Appendix 2—figure 4. Comparison of two runs generated independently from two subsets of patients, subset 1 (red) consisting of 20 patients and subset 2 (green) consisting of 182 patients.
The Kaplan-Meier plot for subset 1 is in solid black and that for subset 2 in dot-dashed black. Since there were many more patients in subset 2 than in subset 1, we expect greater variance in the inferred survival probabilities for subset 1 than for subset 2.

