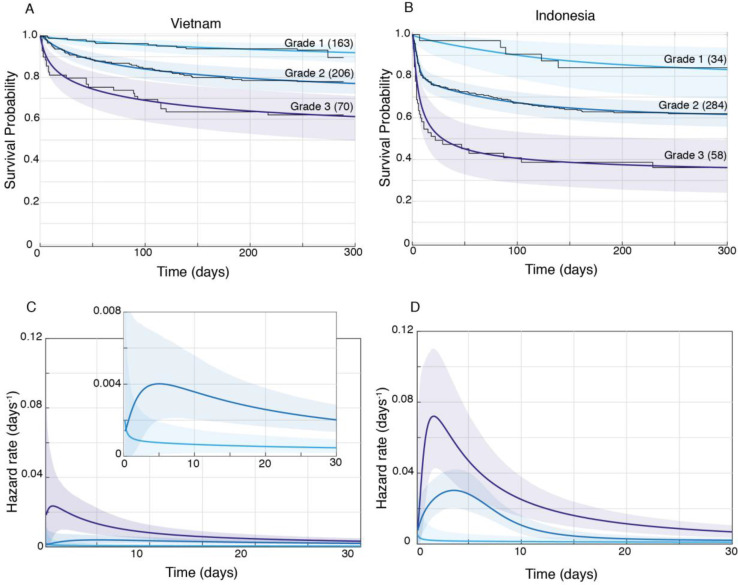
Figure 3. Patient survival, stratified by grade.
Mean posterior survival probability curves (coloured lines) overlaid by Kaplan-Meier survival plots (black lines) for Vietnam (A) and Indonesia (B), and mean posterior hazard rate curves for the first 30 days for Vietnam (C) and Indonesia (D). Shaded areas represent the 95% Bayesian confidence limits for posterior probability. The number of patients in each group at the starting time point are indicated in parentheses. (A) Vietnam Grade 1 over Grade 2 survival was significantly greater from day 7 onwards with maximum probability 0.999, survival gap 14%; Grade 2 over Grade 3 survival was significantly greater from day 1 onwards with maximum probability 0.999, survival gap 16%. (B) Indonesia Grade 1 over Grade 2 survival was significantly greater from day 2 onwards with maximum probability 0.999, survival gap 21%; Grade 2 over Grade 3 survival was significantly greater from day 2 onwards with maximum probability 0.999, survival gap 25%. (C) Vietnam hazard rate ratio was >1 for both grade comparisons (inset magnifies Grade 1 and Grade 2 differences) with Grade 2 over 1 ratio peaking at 5.5 on day 7 and Grade 3 over 2 ratio peaking at 13.9 on day 1. (D) Indonesia Grade 2 over 1 hazard rate ratio was >1 up to day 215 and Grade 3 over 2 ratio was >1 throughout, peaking at 11.2 on day 1 for Grade 2 over 1, and at 2.3 on day 5 for Grades 3 over 2.

