. 2021 Jan 8;10:e60191. doi: 10.7554/eLife.60191

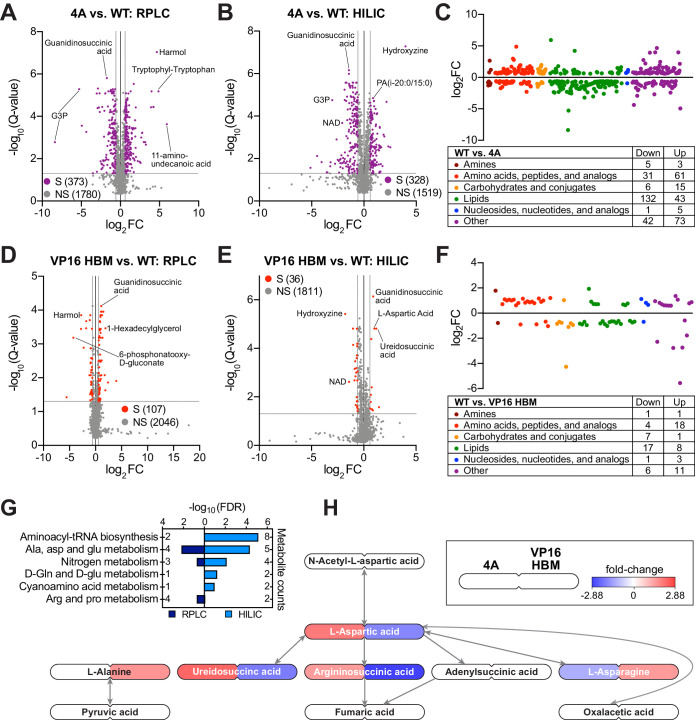
Figure 2. The MYC–host cell factor (HCF)–1 interaction influences intracellular amino acid levels.

(A and B) Volcano plots of metabolites detected by reverse-phase liquid chromatography (RPLC) (A) or hydrophilic interaction liquid chromatography (HILIC) (B) in wild-type (WT) and 4A switchable Ramos cells treated for 24 hr with 20 nM 4-OHT. Metabolites that were significantly (S) changed (false discovery rate [FDR] < 0.05 and |FC| > 1.5) with the 4A MYC mutant compared to WT are colored. Non-significant (NS) changes are in gray. Five biological replicates for WT and four biological replicates for 4A were used to calculate Q-values and fold-changes (FCs). Select metabolites are indicated. (C) Classification of metabolites that were significantly changed (FDR < 0.05 and |FC| > 1.5) with the 4A mutant compared to WT cells. (D and E) Volcano plots of metabolites detected by RPLC (D) or HILIC (E) in WT and VP16 HCF-1-binding motif (HBM) switchable Ramos cells treated for 24 hr with 20 nM 4-OHT. Metabolites that were significantly (S) changed (FDR < 0.05 and |FC| > 1.5) with the VP16 HBM MYC mutant compared to WT are colored. Non-significant (NS) changes are in gray. Five biological replicates for WT and VP16 HBM were used to calculate Q-values and FCs. Select metabolites are indicated. (F) Classification of metabolites that were significantly changed (FDR < 0.05 and |FC| > 1.5) with the VP16 HBM mutant compared to WT cells. (G) Annotated metabolites from Figure 2—figure supplement 1C that were changed in the opposite direction for the 4A and VP16 HBM mutants were independently subjected to pathway enrichment analysis. Pathways with FDR < 0.2 for either RPLC and HILIC are shown. (H) Metabolites (FDR < 0.05) in the ‘alanine, aspartate, and glutamate metabolism’ pathway that were impacted by the 4A (left) and VP16 HBM (right) MYC mutants. Node color represents the FC over WT. The remainder of the pathway is shown in Figure 2—figure supplement 1E and F.

Figure 2—source data 1. Ramos 4A and VP16 host cell factor (HCF)–1-binding motif reverse-phase liquid chromatography significant changes.
Figure 2—source data 2. Ramos 4A and VP16 host cell factor (HCF)–1-binding motif hydrophilic interaction liquid chromatography significant changes.

Figure 2.

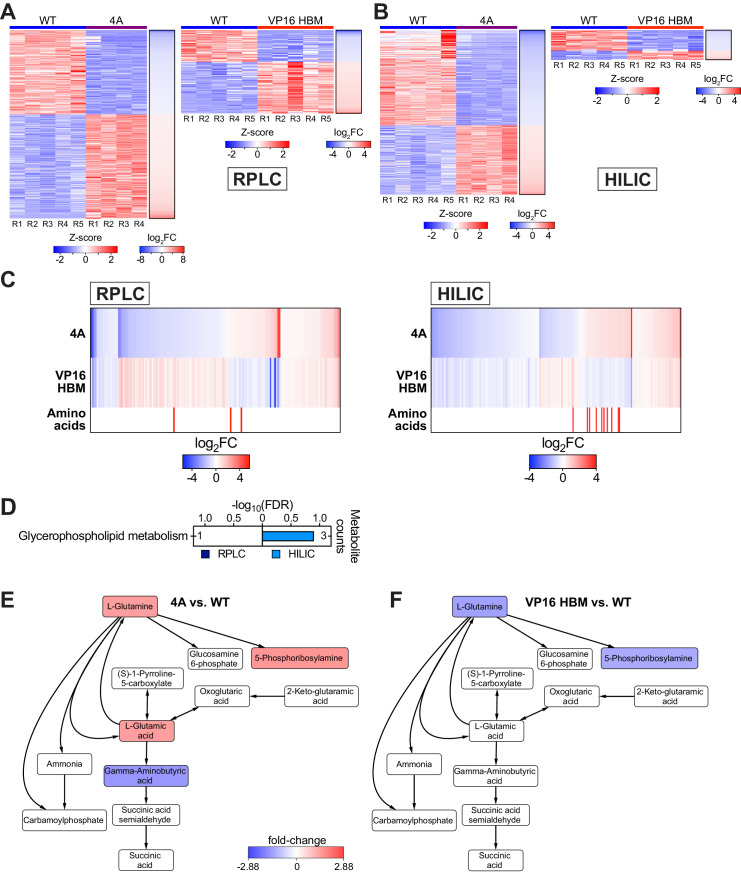
Figure 2—figure supplement 1. Impact of the 4A and VP16 HCF-1-binding motif (HBM) mutants on Ramos cell metabolites.

Figure 2—figure supplement 1.

All data are derived from switchable Ramos cells treated with 20 nM 4-OHT for 24 hr. (A and B) Heatmap visualizing consistency between replicates of metabolites (z-transformed) detected with reverse-phase liquid chromatography (RPLC) (A) or hydrophilic interaction liquid chromatography (HILIC) (B) that were significantly (false discovery rate [FDR] < 0.05 and |FC| > 1.5) impacted by the 4A (left) or VP16 HBM (right) MYC mutants. Shown alongside each is a heatmap is the log2FC as calculated from the raw data. (C) Heatmap showing metabolites detected with RPLC (left) or HILIC (right) that are significantly (FDR < 0.05) changed for both the 4A and VP16 HBM mutants, compared to wild-type (WT) MYC. Metabolites are clustered according to the relationship between the two mutants, and ranked by the log2FC of 4A versus WT. The position of amino acids is highlighted in red. (D) Annotated metabolites from (C) that were changed in the same direction for the 4A and VP16 HBM mutants were independently subjected to pathway enrichment analysis. Pathways with FDR < 0.2 for either RPLC and HILIC are shown. (E) Metabolites in the ‘alanine, aspartate, and glutamate metabolism’ pathway that are significantly (FDR < 0.05) impacted in the 4A mutant. Node color represents the fold-change (FC) over WT. The remainder of the pathway is shown in Figure 2H. (F) Metabolites in the ‘alanine, aspartate, and glutamate metabolism’ pathway that are significantly (FDR < 0.05) impacted in the VP16 HBM mutant. Node color represents the FC over WT. The remainder of the pathway is shown in Figure 2H.