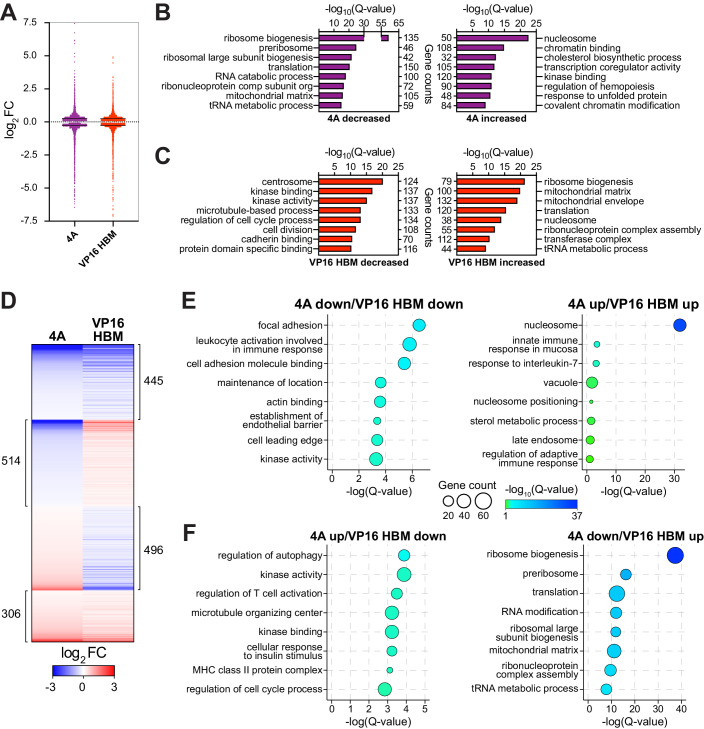
Figure 3. The MYC–host cell factor (HCF)–1 interaction influences the expression of genes involved in ribosome biogenesis and mitochondrial pathways.
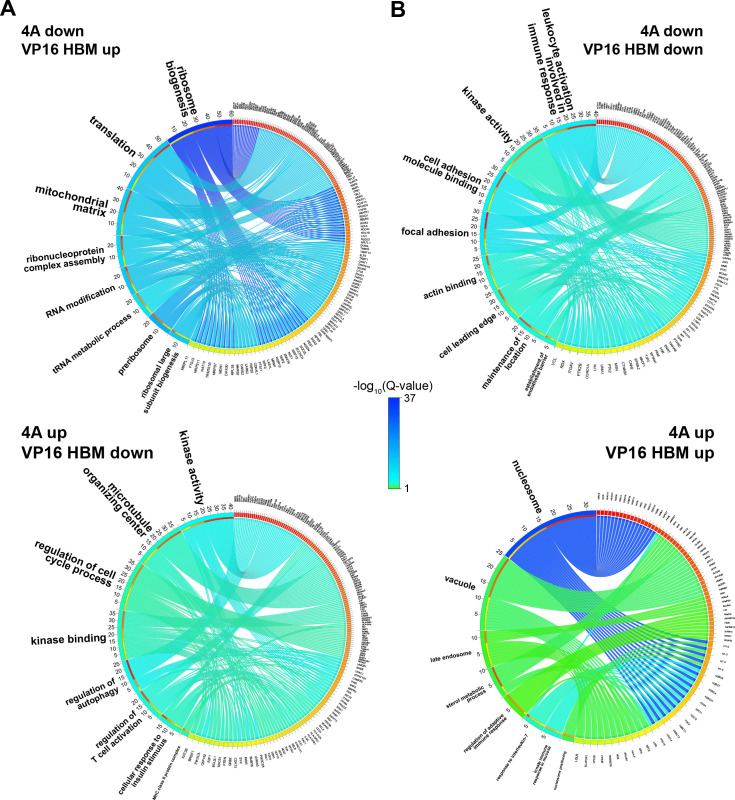
Switchable Ramos cells were treated with 20 nM 4-OHT for 24 hr, RNA isolated, and RNA-Seq performed. (A) Scatterplot showing the distribution of log2FC of significant (false discovery rate [FDR] < 0.05) RNA-Seq changes with the 4A and VP16 HCF-1-binding motif (HBM) MYC mutants, compared to the wild-type (WT) switch. Solid lines represent the median log2FC for decreased (4A: −0.2858; VP: −0.2747) and increased (4A: 0.281; VP: 0.2558) transcripts compared to WT. For clarity, some data points were excluded; these data points are highlighted in Figure 3—source data 1 and 2. (B and C) Categories from the top eight families in gene ontology (GO) enrichment analysis of significant (FDR < 0.05) gene expression changes under each condition (B: 4A; C: VP16 HBM). (D) Heatmap showing the log2FC of significantly (FDR < 0.05) changed transcripts that are altered in expression in both the 4A and VP16 HBM mutants. Transcripts are clustered according to the relationship in expression changes between the 4A and VP16 HBM mutants, and ranked by the log2FC for the 4A mutant. Scale of heatmap is limited to [−3,3]. (E and F) Gene clusters in (D) were subject to GO enrichment analysis, and the top eight categories are shown for the correlative (E) or anti-correlative (F) clusters. The Q-value of categories is represented by bubble color, and the number of genes present in a category is represented by bubble size. The genes in these categories are identified in Figure 3—figure supplement 2A and B.


