. 2021 Jan 8;10:e60191. doi: 10.7554/eLife.60191

Figure 4. Genes regulated by the MYC−host cell factor (HCF)–1 interaction are impacted by loss of HCF-1.

(A) Western blot, comparing the effects of treating untagged parental cells or FKBPFV-HCF-1N Ramos cells with DMSO or 500 nM dTAG-47 for 24 hr. Blots for HCF-1N, FLAG tag, HCF-1C, and GAPDH are shown. (B) Western blot of lysates from FKBPFV-HCF-1N Ramos cells treated with 500 nM dTAG-47 for varying times, compared to cells treated with DMSO for 24 hr. Shown are short and long exposures of HCF-1N, and HCF-1C, with a GAPDH loading control. (C) Growth curve of FKBPFV-HCF-1N Ramos cells treated with DMSO or 500 nM dTAG-47. Cells were counted every 24 hr for 4 days after plating. Shown are the mean and standard error for three biological replicates. Student’s t-test was used to calculate p-values; a = 0.0029, b = 0.000051, c = 0.000040. (D) Scatterplot showing the distribution of log2FC in RNA-Seq comparing DMSO to 3 hr of 500 nM dTAG-47 treatment (degradation of HCF-1N). Solid lines represent the median log2FC for decreased (−0.425655) and increased (0.270428) transcripts. For clarity, one data point was excluded; this data point is highlighted in Figure 4—source data 2. (E) Gene ontology enrichment analysis of transcripts significantly (false discovery rate [FDR] < 0.05) decreased (top) and increased (bottom) in expression following treatment of FKBPFV-HCF-1N Ramos cells with dTAG-47 for 3 hr. Excluded from this analysis are transcripts that were significantly changed when parental Ramos cells were treated with dTAG-47 for 3 hr. (F) Heatmap showing the log2FC of transcripts with significantly (FDR < 0.05) changed expression, as measured by RNA-Seq, under the indicated conditions. Transcripts are clustered according to the relationship in expression changes between the 4A and VP16 HBM mutants, and ranked by the log2FC for the 4A mutant. Scale of heatmap is limited to [−3,3]. (G) Box-and-whisker plot showing the relationship between transcripts that are anti-correlated between the 4A and VP16 HBM MYC mutants, and significantly changed with the degradation of HCF-1N. Box denotes the 25th to 75th percentile, whiskers extend from minimum to maximum point, and middle line marks the median (4A down/VP16 HBM up: −0.2276; 4A up/VP16 HBM down: 0.2349).

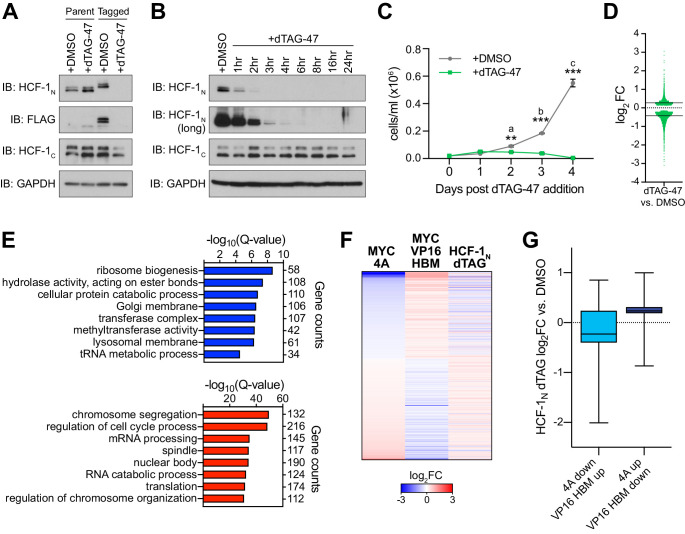
Figure 4—source data 1. Raw data for host cell factor (HCF)–1N degradation growth curve.
Figure 4—source data 2. Ramos host cell factor (HCF)–1N degradation RNA-Seq significant changes.
elife-60191-fig4-data2.xlsx (258.2KB, xlsx)
Figure 4—source data 3. Ramos untagged RNA-Seq significant changes.

Figure 4.

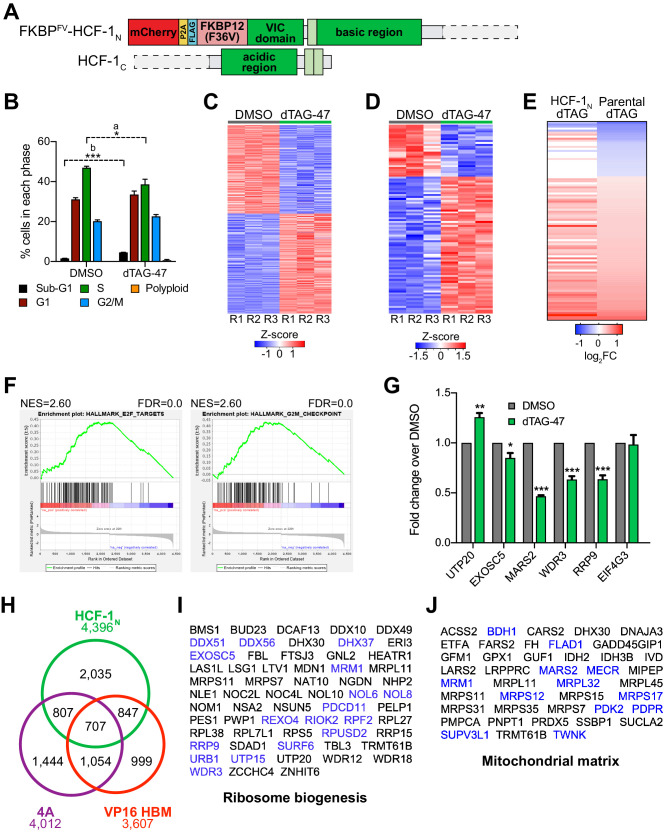
Figure 4—figure supplement 1. Inducible degradation of host cell factor (HCF)–1N.

Figure 4—figure supplement 1.

(A) Schematic of the HCF-1 fusion protein in Ramos FKBPFV-HCF-1N Ramos cells, which were generated using CRISPR/Cas9 homology-directed repair. Fused to the N-terminus of the VP16-induced complex (VIC) domain is mCherry linked by P2A to FLAG-tagged FKBP12FV. (B) Cell cycle distribution was determined using propidium iodide (PI) staining of FKBPFV-HCF-1N Ramos cells treated with DMSO or 500 nM dTAG-47 for 24 hr. Shown are the mean and standard error for three biological replicates. Student’s t-test was used to calculate p-values; a = 0.037, b < 0.0001. (C) Heatmap of significantly (false discovery rate [FDR] < 0.05) changed transcripts in FKBPFV-HCF-1N Ramos cells treated with DMSO or dTAG-47 for 3 hr. Shown are the z-transformed expression data for three biological replicates of RNA-Seq, ranked by fold-change (FC). (D) Heatmap of significantly (FDR < 0.05) changed transcripts in parental Ramos cells treated with DMSO or 500 nM dTAG-47 for 3 hr. Shown are the z-transformed expression data for three biological replicates of RNA-Seq, ranked by FC. (E) Heatmap showing the log2FC of all transcripts that are significantly (FDR < 0.05) changed when untagged Ramos cells were treated with DMSO or dTAG-47 for 3 hr, and the corresponding log2FC data in FKBPFV-HCF-1N Ramos cells. (F) Gene set enrichment analysis (GSEA) of significantly (FDR < 0.05) changed transcripts in FKBPFV-HCF-1N Ramos cells. Shown are the normalized enrichment scores (NES) and FDR for each gene set. (G) Validation of select RNA-seq changes in FKBPFV-HCF-1N Ramos cells. Cells were grown with DMSO or dTAG-47 for 3 hr, RNA isolated, RT-qPCR performed, and Ct values normalized to those for GAPDH. Fold-changes were then calculated over DMSO-treated samples. Shown are the mean and standard error for three biological replicates. Student’s t-test between DMSO and dTAG-47-treated cells was used to calculate p-values. *p<0.05, **p<0.01, ***p<0.001. (H) Venn diagram showing overlap of gene transcripts that are significantly (FDR < 0.05) changed in RNA-Seq with the 4A and VP16 HCF-1-binding motif (HBM) mutants, and with degradation of HCF-1N in Ramos cells. (I and J) Transcripts that are decreased with the 4A MYC mutant and increased with the VP16 HBM MYC mutant and fall into the ‘Ribosome biogenesis’ (I) or ‘Mitochondrial matrix’ (J) gene ontology categories. Highlighted in blue are the genes that are also significantly decreased with degradation of HCF-1N.