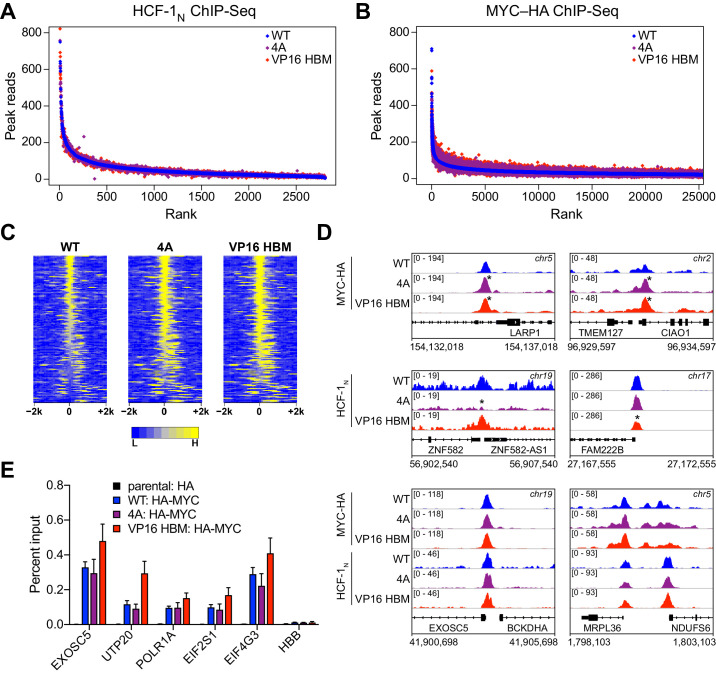
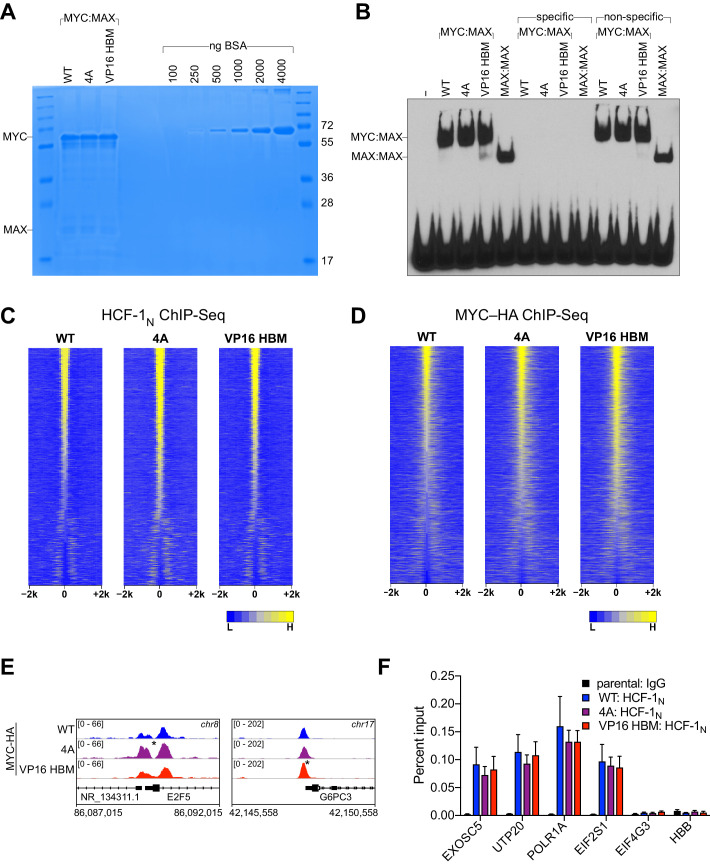
Figure 6. MYC and host cell factor (HCF)–1 bind chromatin independent of their ability to interact.
(A) Scatterplots of normalized average read counts for HCF-1N ChIP-seq peaks in wild-type (WT), 4A, or VP16 HCF-1-binding motif (HBM) switched cells. (B) As in (A) but showing normalized average read counts for MYC–HA ChIP-seq peaks. (C) Heatmap of the combined average normalized peak intensity in 100 bp bins for MYC-HA peaks that were significantly changed (false discovery rate [FDR] < 0.05 and |log2FC| > 0.7) for both the 4A and VP16 HBM mutants, and were within ±2 kb of a TSS. (D) Example IGV screenshots of regions that had significant (top) or non-significant (bottom) changes for MYC-HA or HCF-1N by ChIP-seq. Asterisks mark the peaks that were significantly changed compared to WT. (E) ChIP, using anti-HA antibody, was performed on parental or switchable Ramos cells treated for 24 hr with 20 nM 4-OHT. Enrichment of genomic DNA was monitored by qPCR using primers that amplify across peaks. HBB is a negative locus for HA-MYC. ChIP efficiency was measured based on the percent recovery from input DNA. Shown are the mean and standard error for three biological replicates.


